|
|

Jesse Gordon for Randolph Town Council >
Events> Water Data
Jesse's first release of water quality data
Following is a sampling of Randolph's water quality data.
There are dozens of reports like this created each week.
I'm asking that they be released to the public, each week, so we can see for ourselves our water quality. The town's water authorities ask us to trust them that the water quality is ok -- I prefer "trust but verify."
The 2018 Water Quality Report that was released in February 2019 is an annual summary of these daily reports. The DPW's Water Division will release another annual summary sometime around February 2020, and it will presumably say the same as the 2018 report: on average, everything was fine; and the water was always safe to drink, according to state minimum standards. That's what the Town Manager and our water officials said in the Sept. 12 Community Water Forum -- which is all true, technically.
But we don't drink our water by annual summary -- we drink it every day in every neighborhood -- so we need to see the data for particular days for particular neighborhoods. I show a dozen samples of the raw data below, with explanations. I used the "people's subpoena" to extract public records of our own water quality data -- it was a long and difficult process! That data SHOULD be made public on a routine basis, every week -- we need to see the data from last WEEK, not from last YEAR!
My goal is to put all this raw data into a spreadsheet table, then let residents ask for a particular day and a particular neighborhood -- like I did for the Tucson Arizona Water Department in the early 2000s. Then you can see what water quality problems there were, each week, near your home.
Sure, that costs money to do -- but there are plenty of state and federal grants available for that. I was paid by an EPA "EMPACT grant" for my work for the Tucson Water Department -- and I've called for Randolph to hire a full-time grant-writer to look for grant funding that would apply to Randolph's water crisis, among other needs. I even found one such appropriate grant at the Statewide Municipal Partnerships Conference last week.
Here are some of the raw water quality reports, with some explanations:
| At the water treatment plant: |
|---|
Image Water Quality test Date Result Explanation
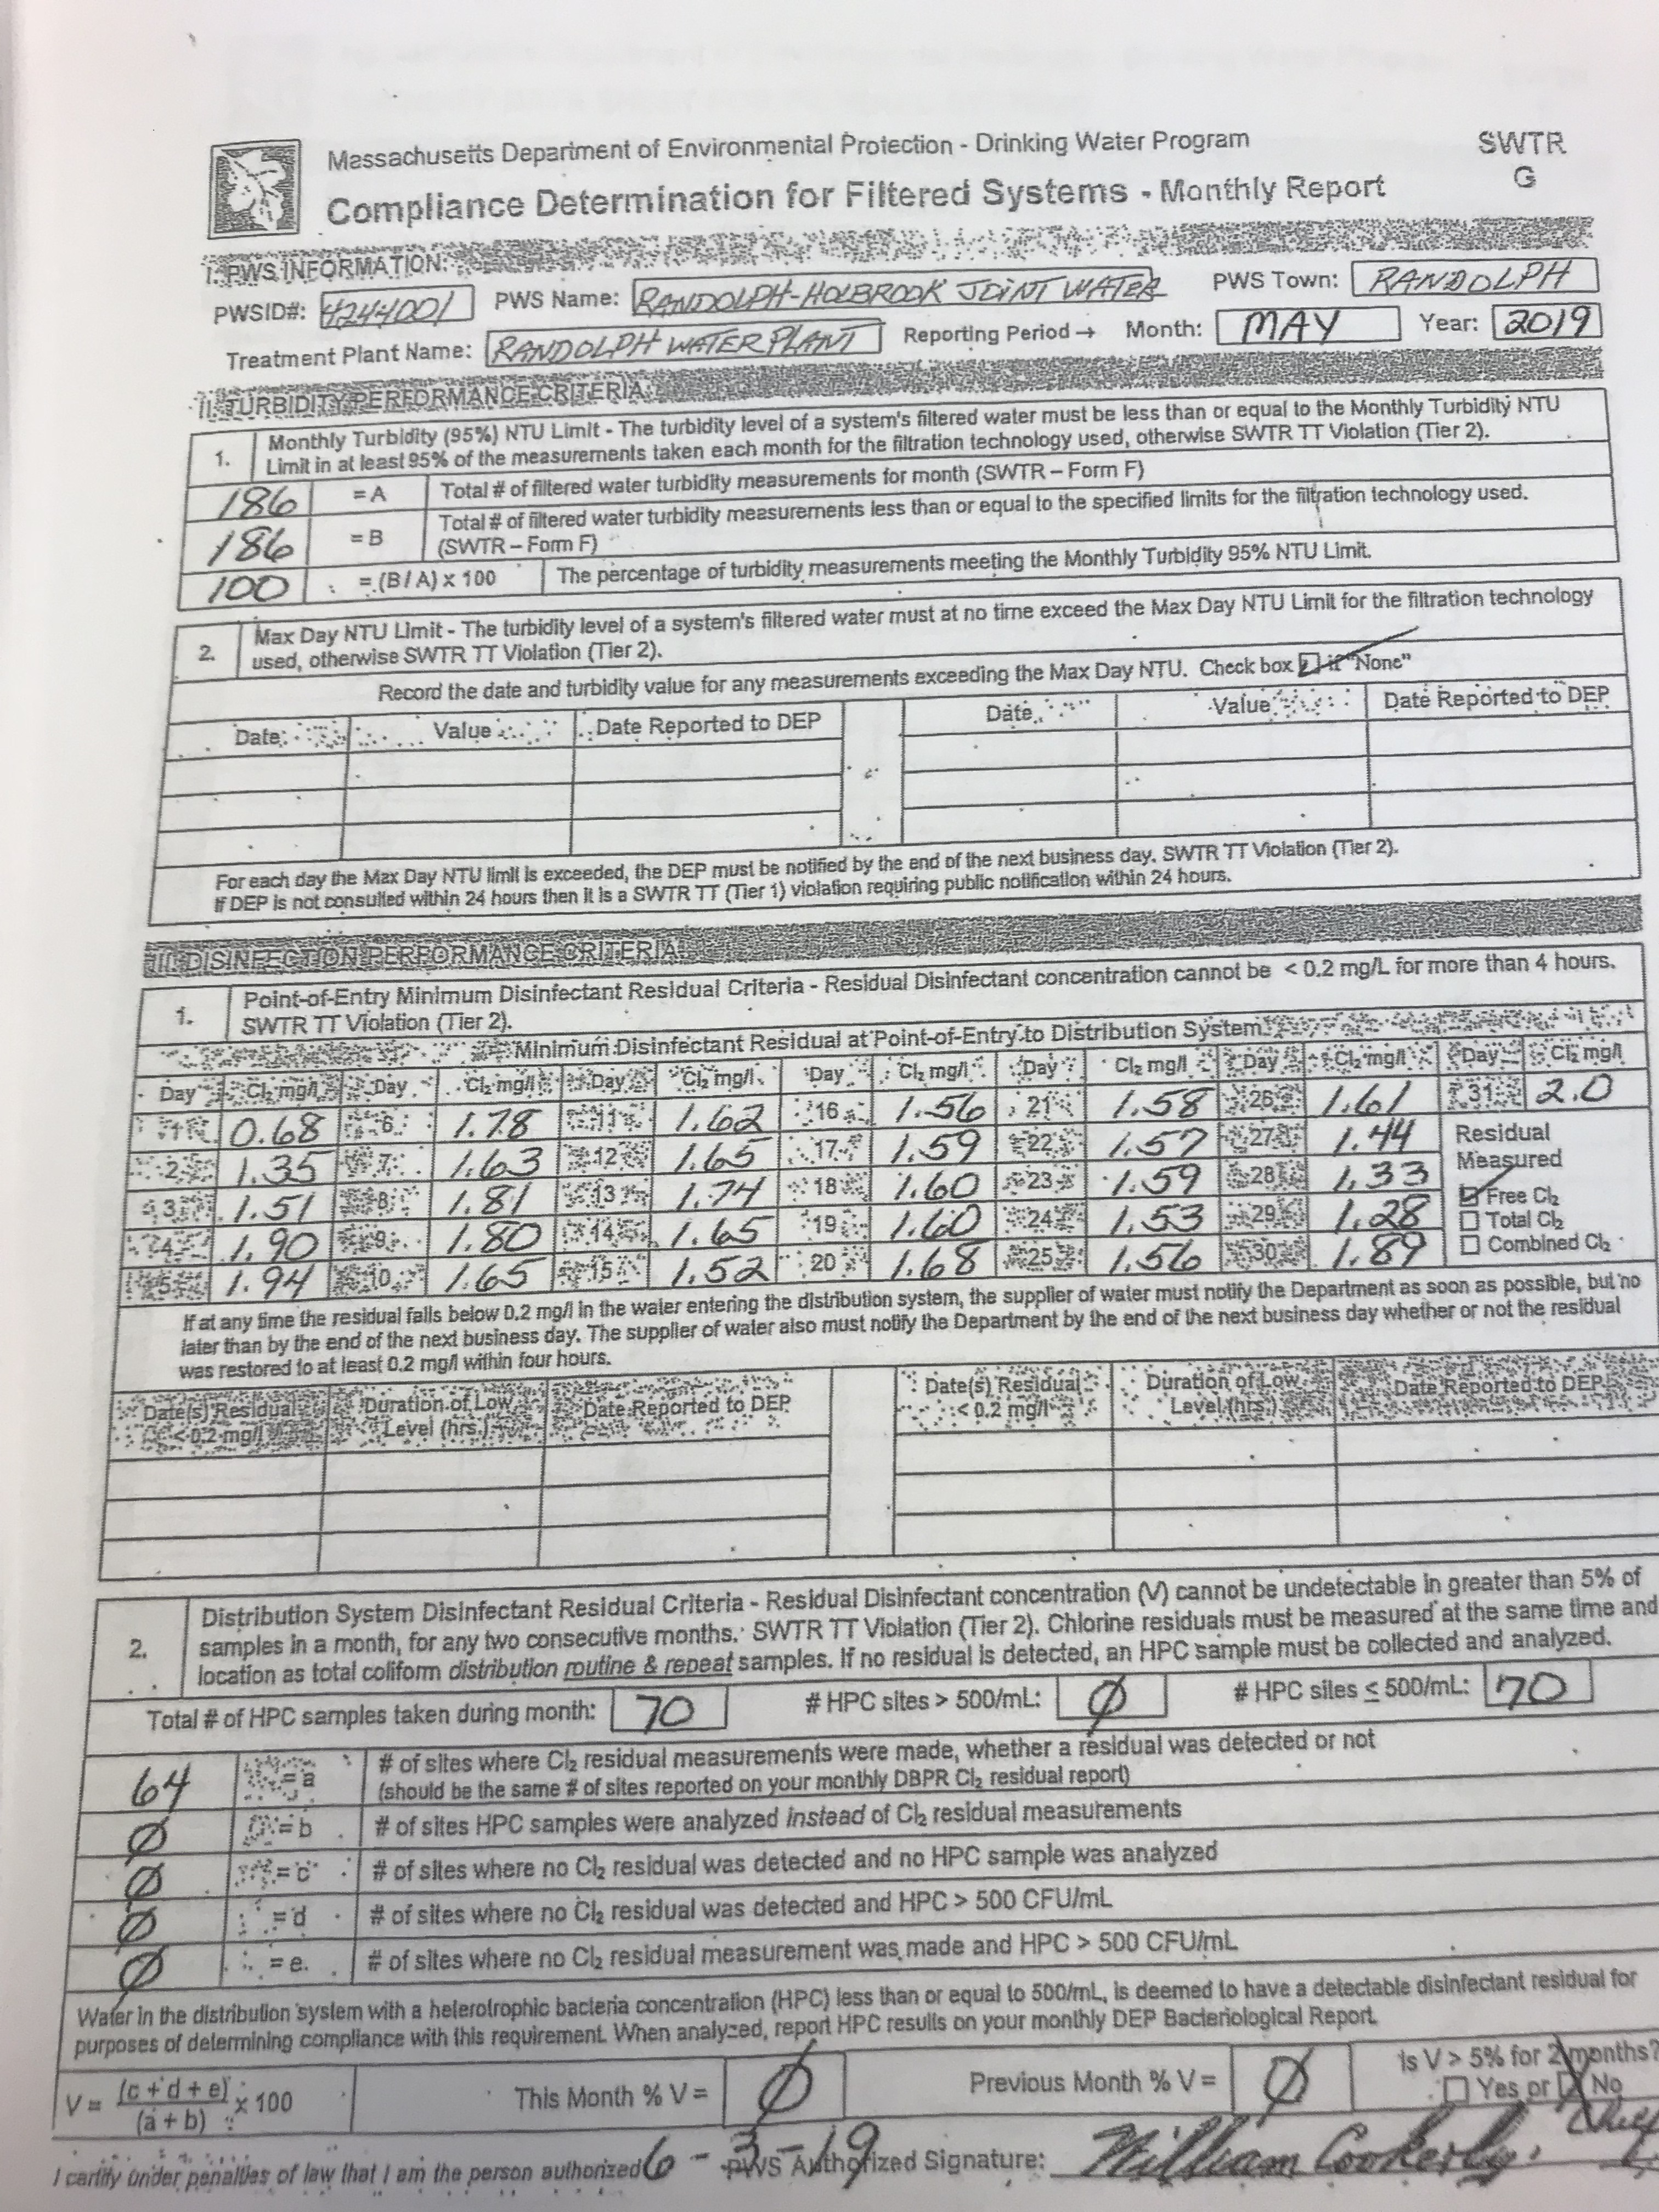
| Document 2123 | May 2019 | Monthly turbidity and chlorine summary at plant; 186 turbidity measurements made; 5 days of Cl2; all passed. |
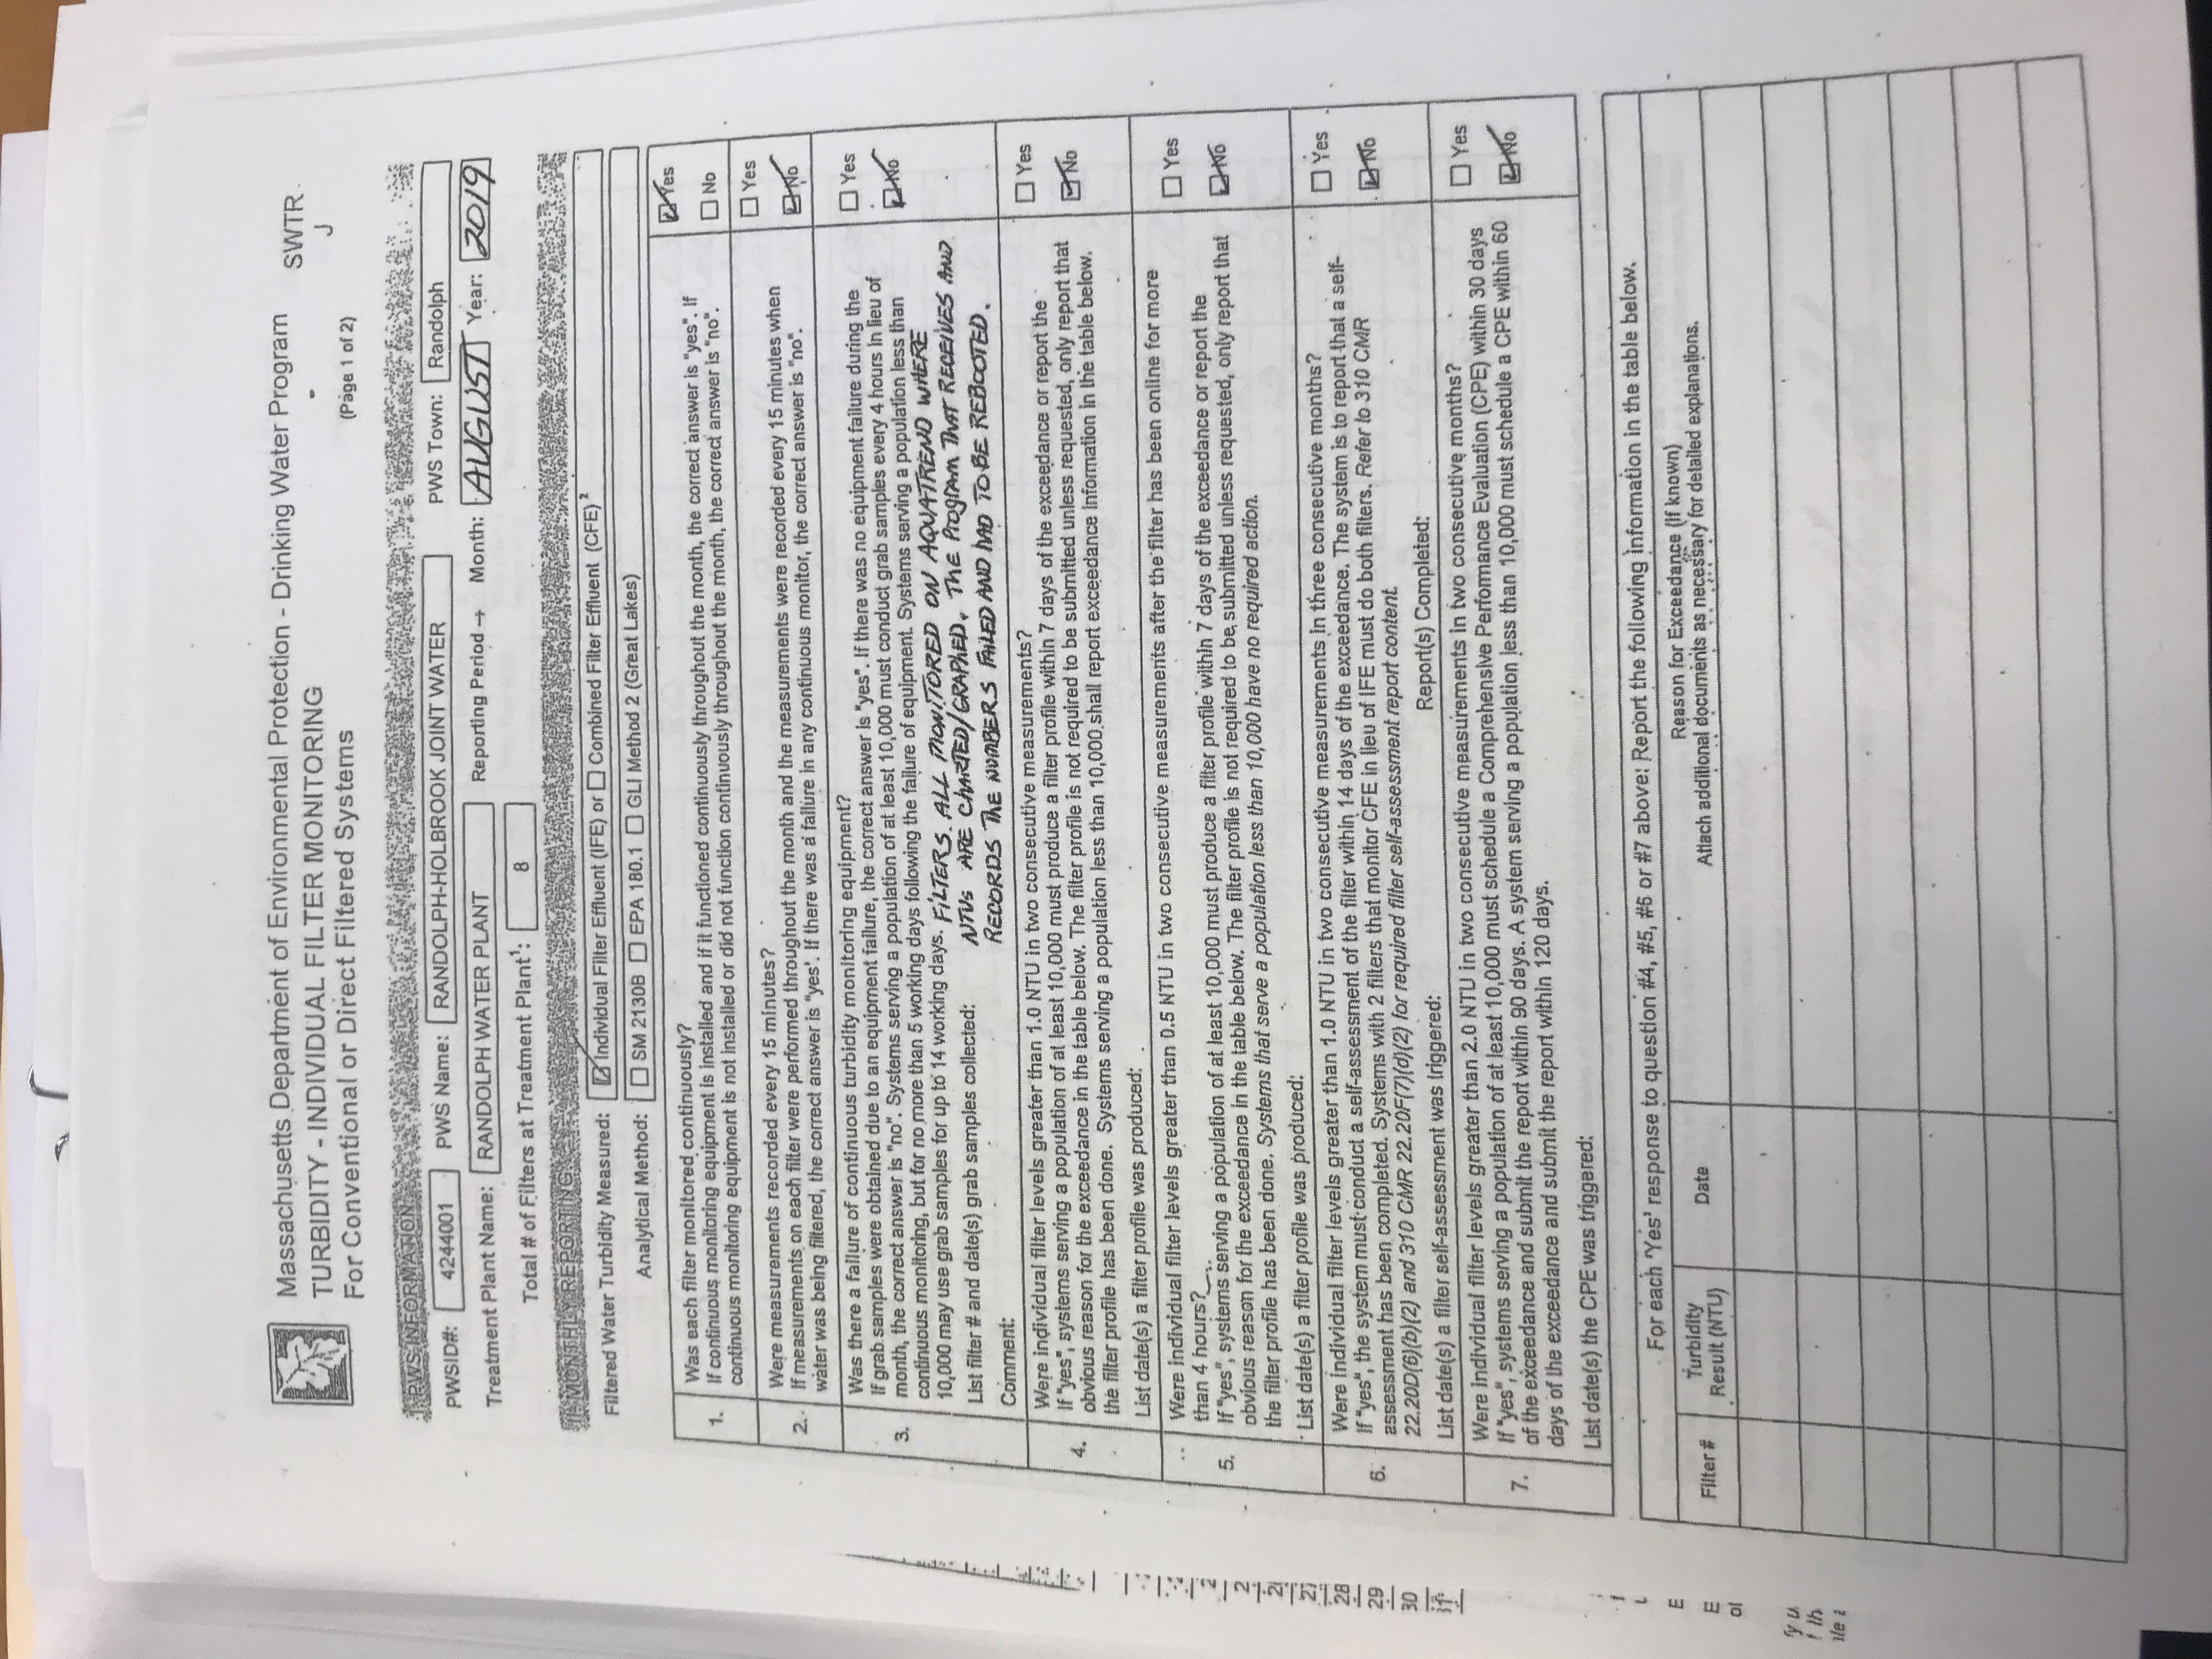
| Document 2129 | Aug. 2019 | Turbidity filter monitoring - summary |
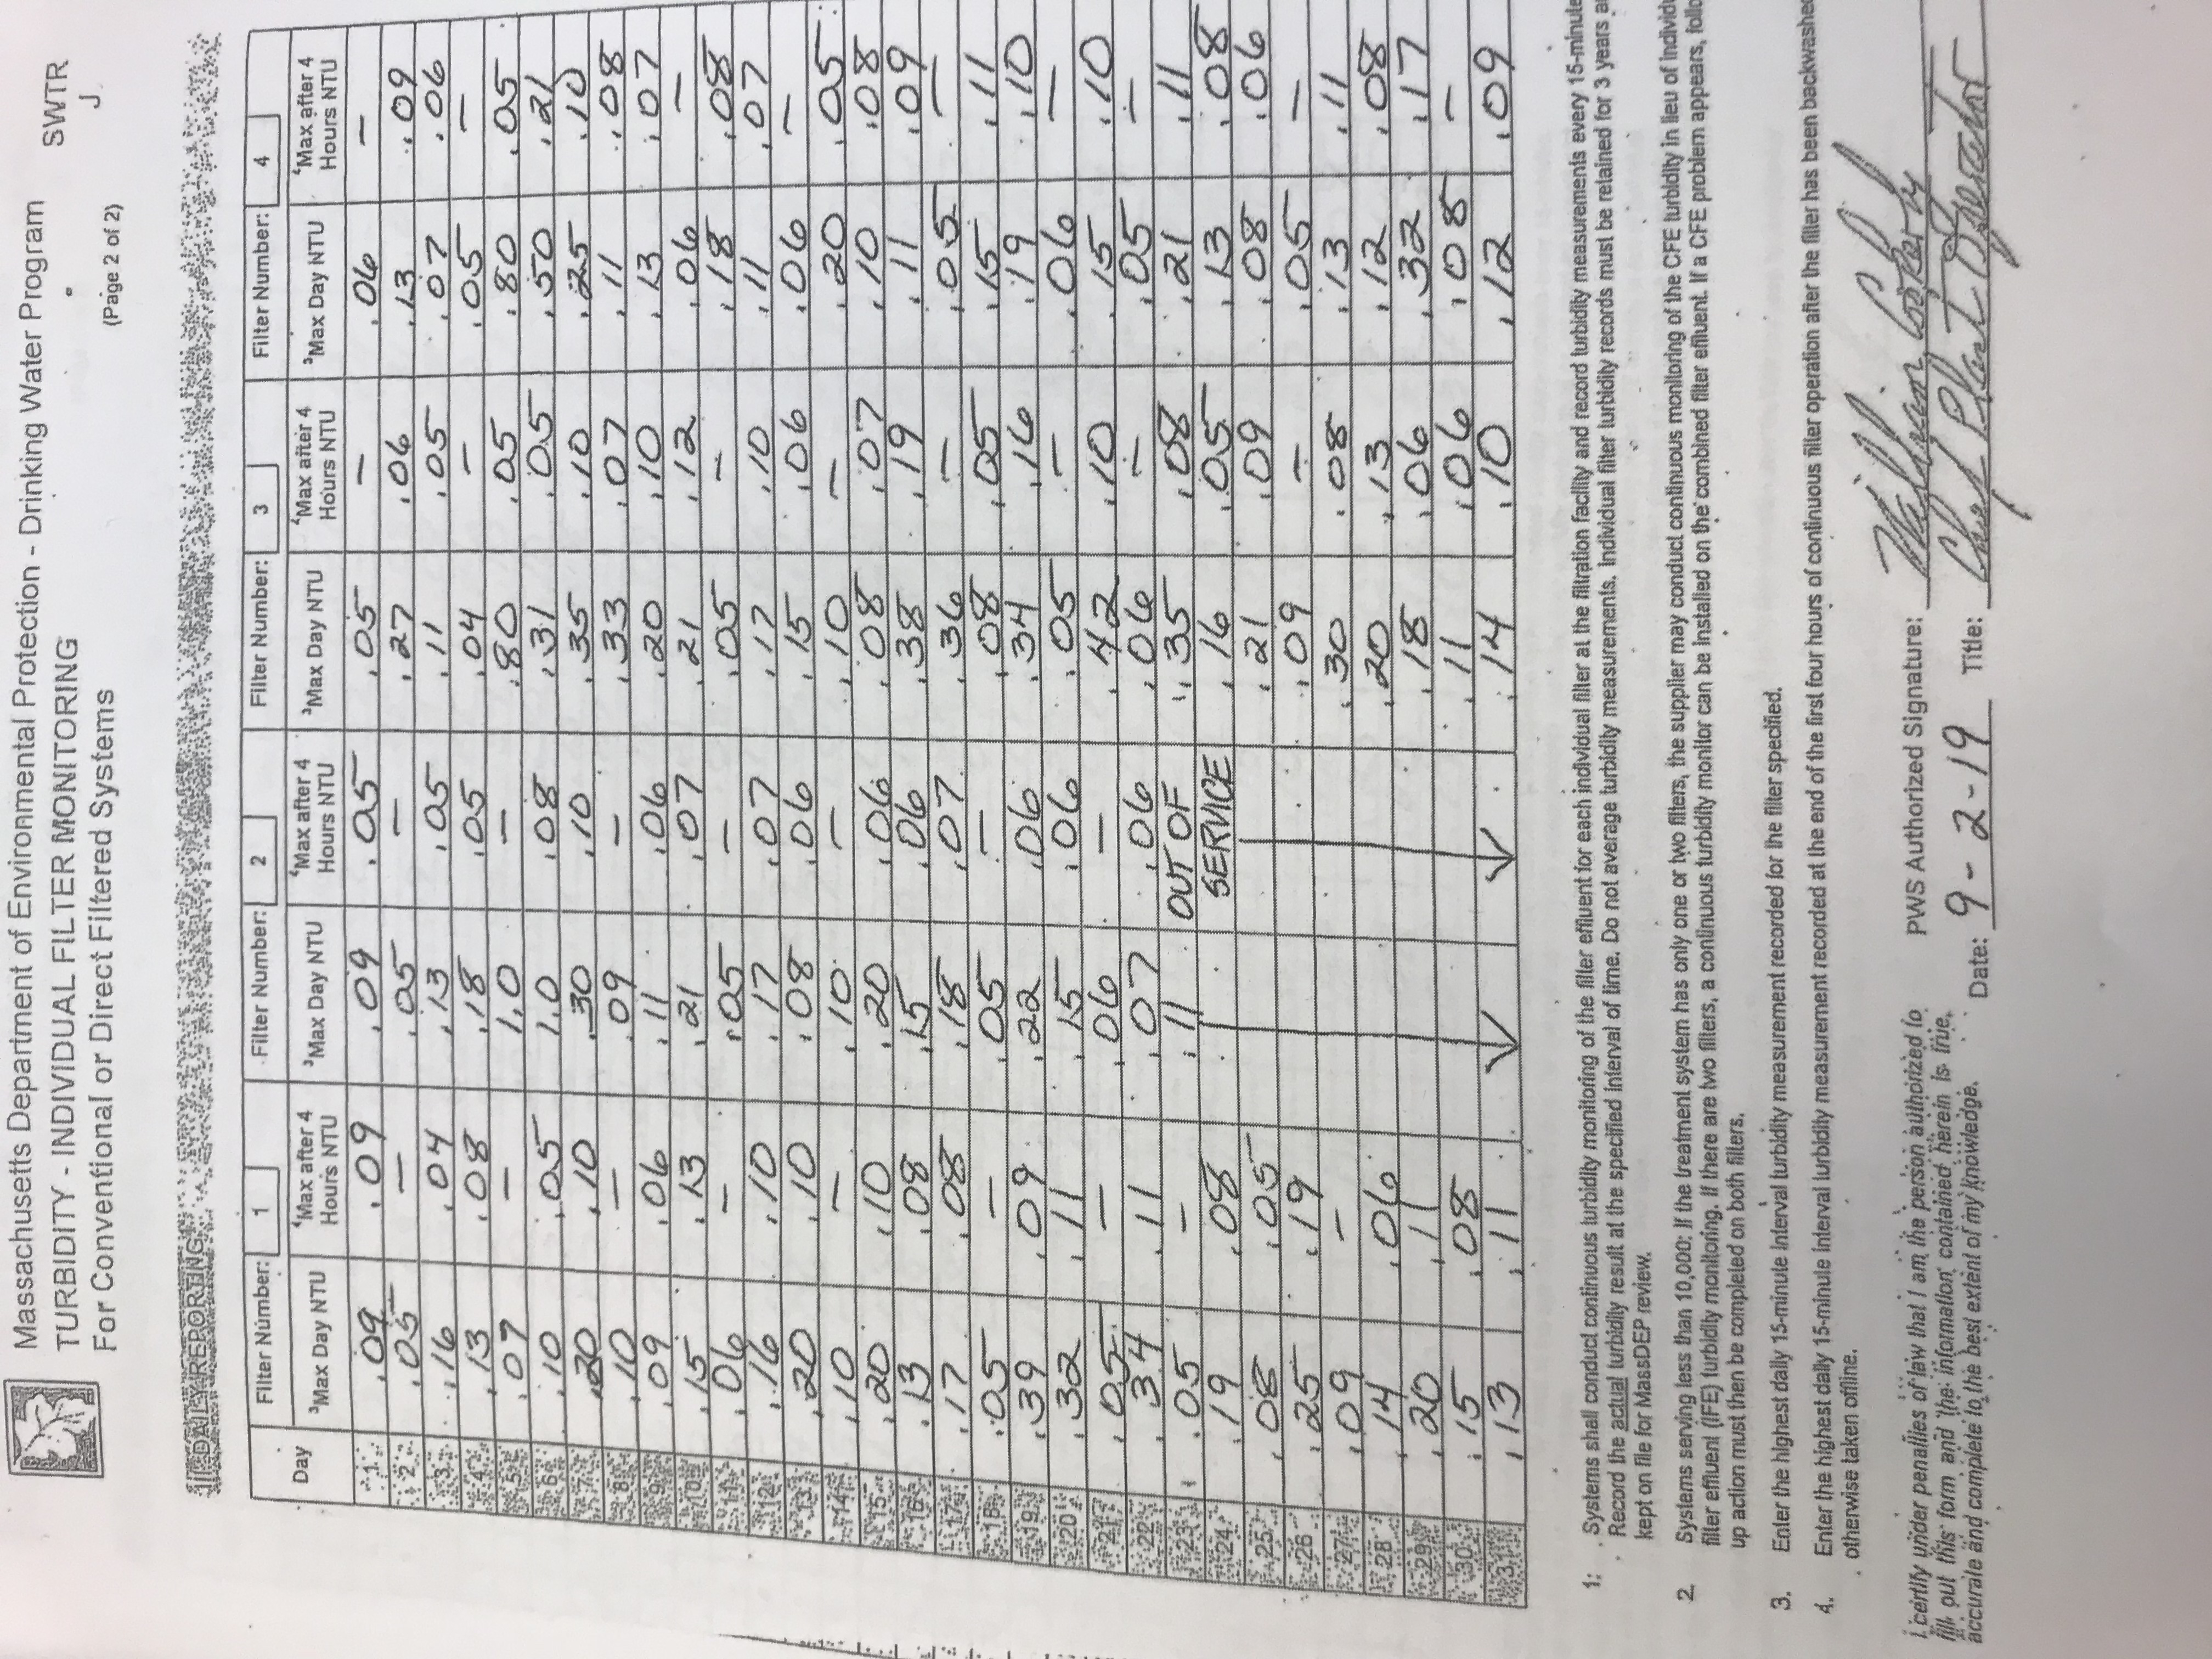
| Document 2130 | 9/2/2019 | Turbidity filter monitoring - details |
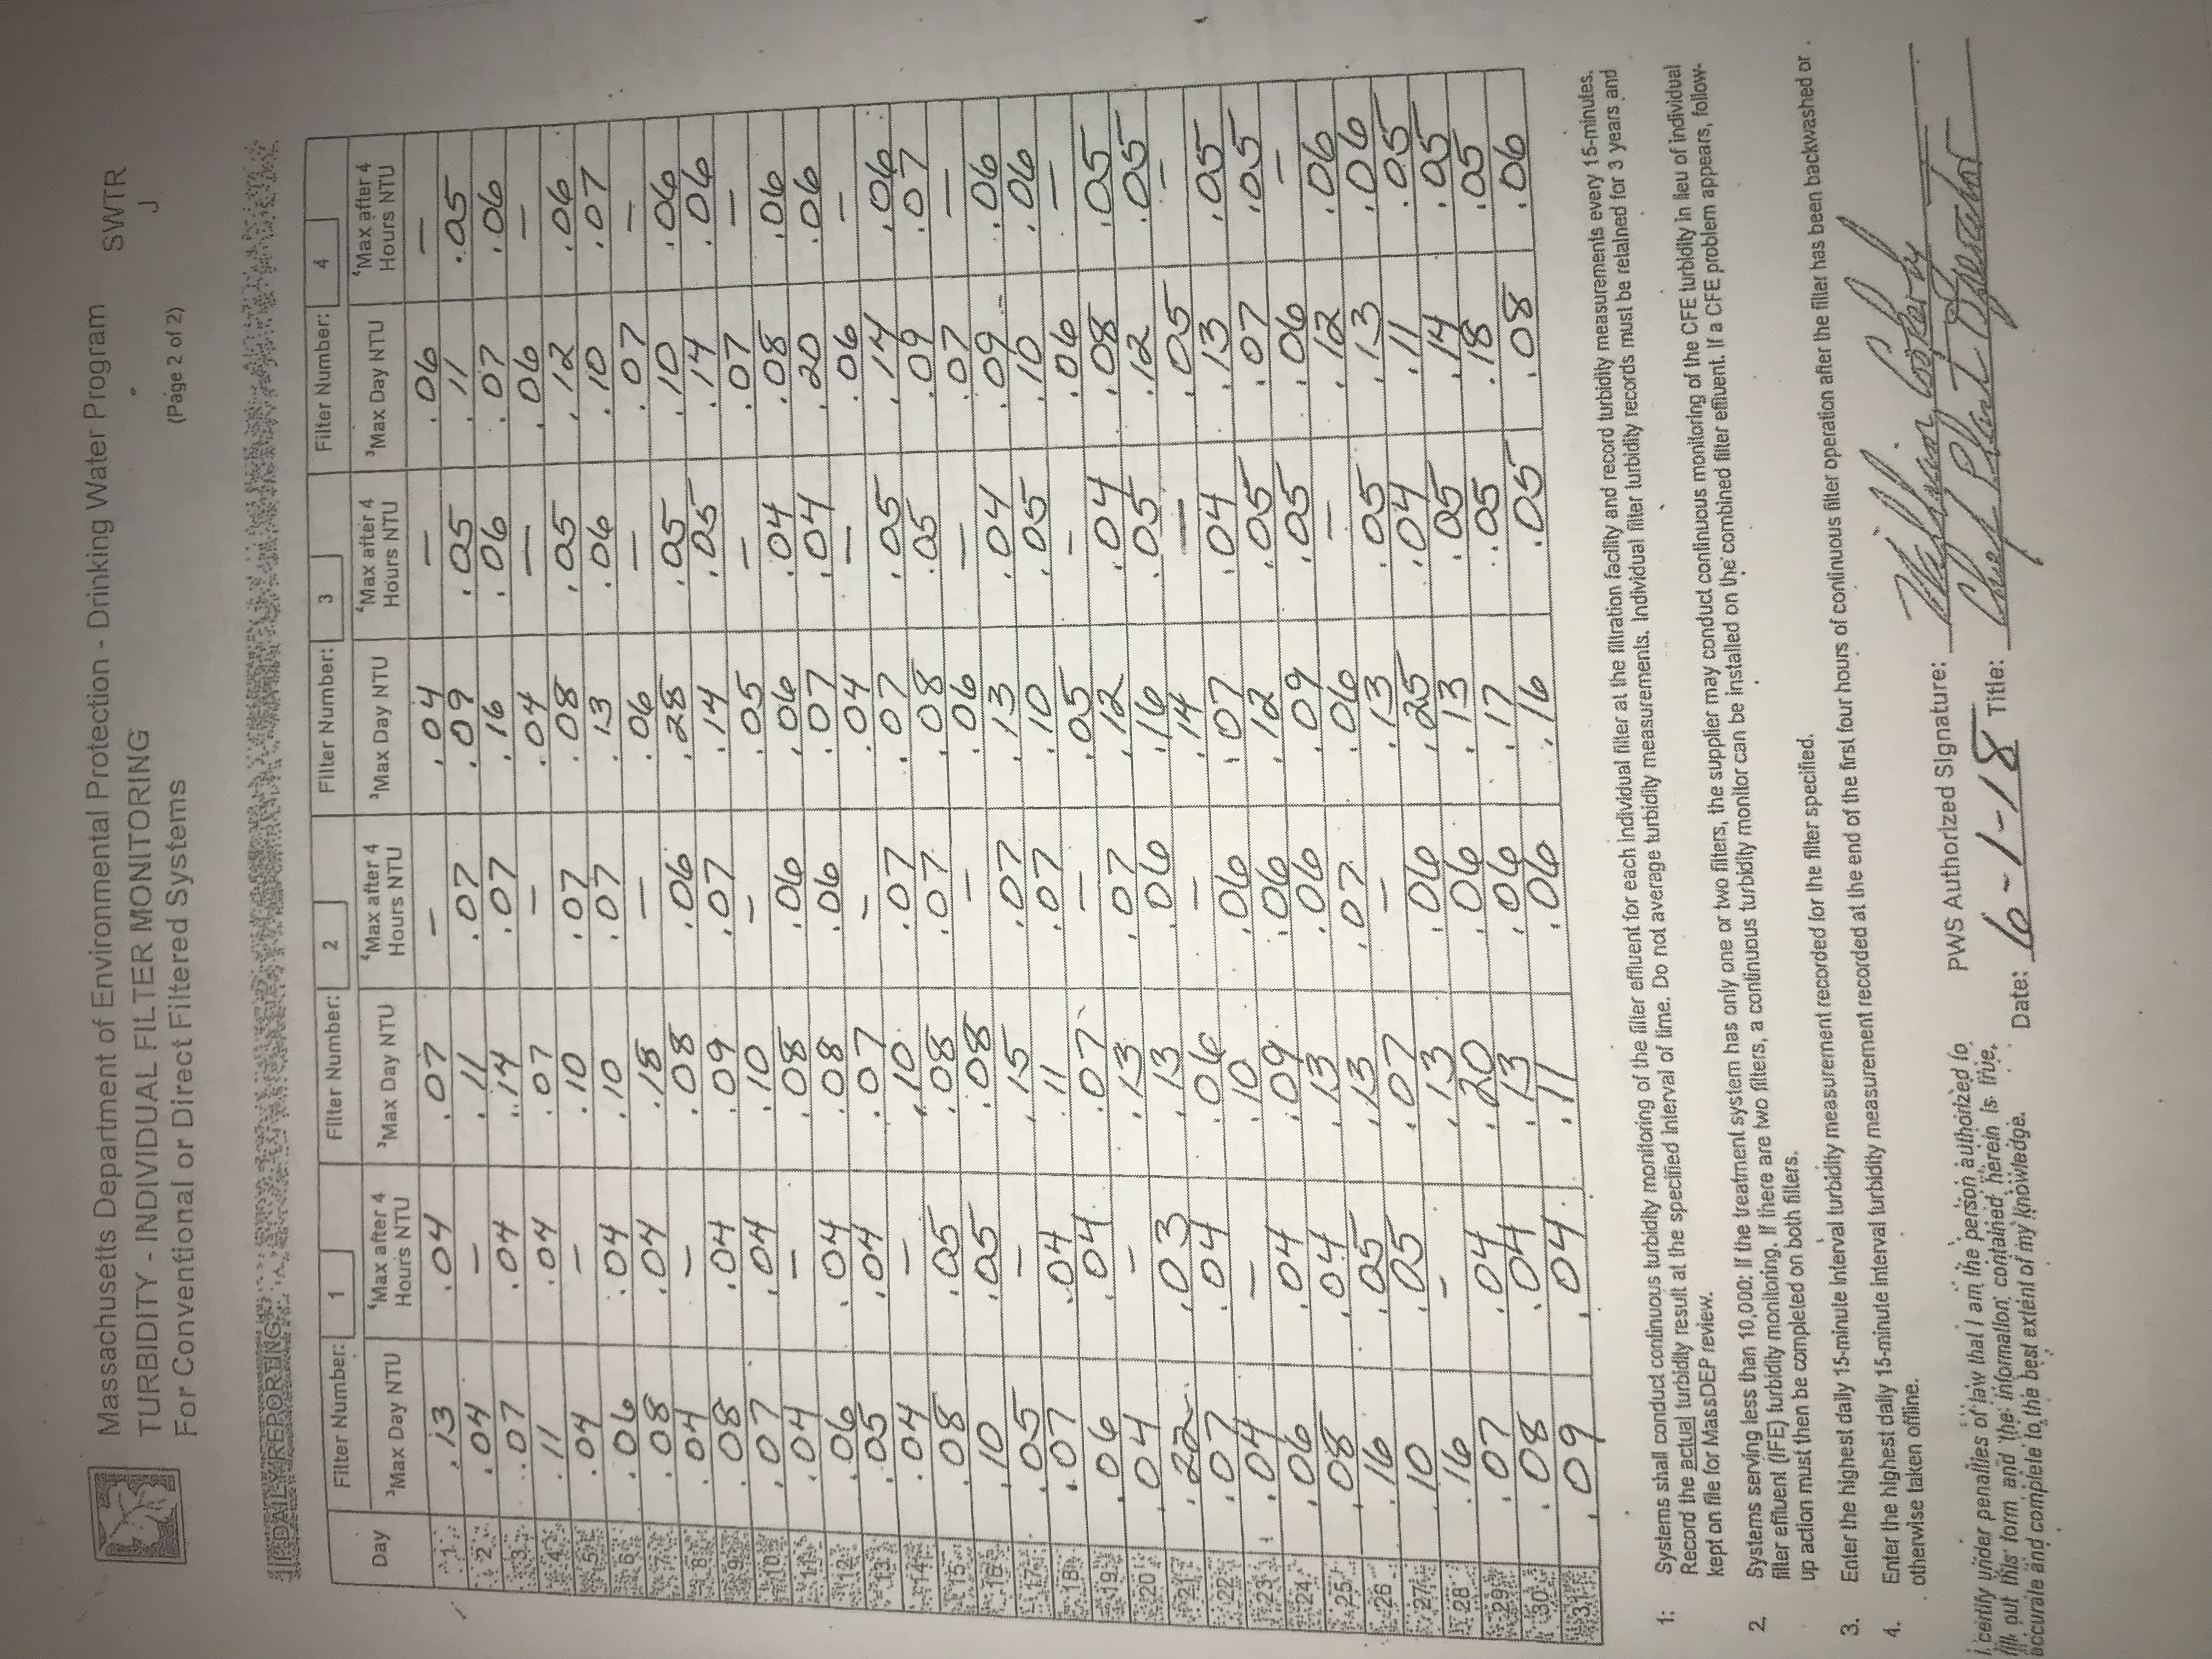
| Document 2224 | Turbidity | NTUs (Turbidity Units) | Summary report | Turbidity measures finely dissolved suspended solids: more means the water looks brown or cloudy; less means the water looks clear. It's measured coninuously, on 8 different filters at the water treatment plant, and the value recorded every 15 minutes for each filter. Then it's summarized by day, with a maximum and an average. Allowed range is "< 1 NTU". Turbidity normally results from soil runoff (that is what would be measured at the water treatment plant); in Randolph it comes from sloughing off the lining of our distribution system's pipes (that is NOT measured in this report!). |
| Document 2225 | Turbidity | NTUs (Turbidity Units) | 0.04 NTU - 0.22 NTU | This is the daily turbidiy summary for 4 of our 8 different filters at the water treatment plant, showing the maximum turbidity reading each day (from recordings made every 15 minutes). This indicates that our water leaves the water treatment plant with low turbidity -- this is what our town officials mean when they say "our water passes all state tests." But these state tests don't measure the problem we're having! |
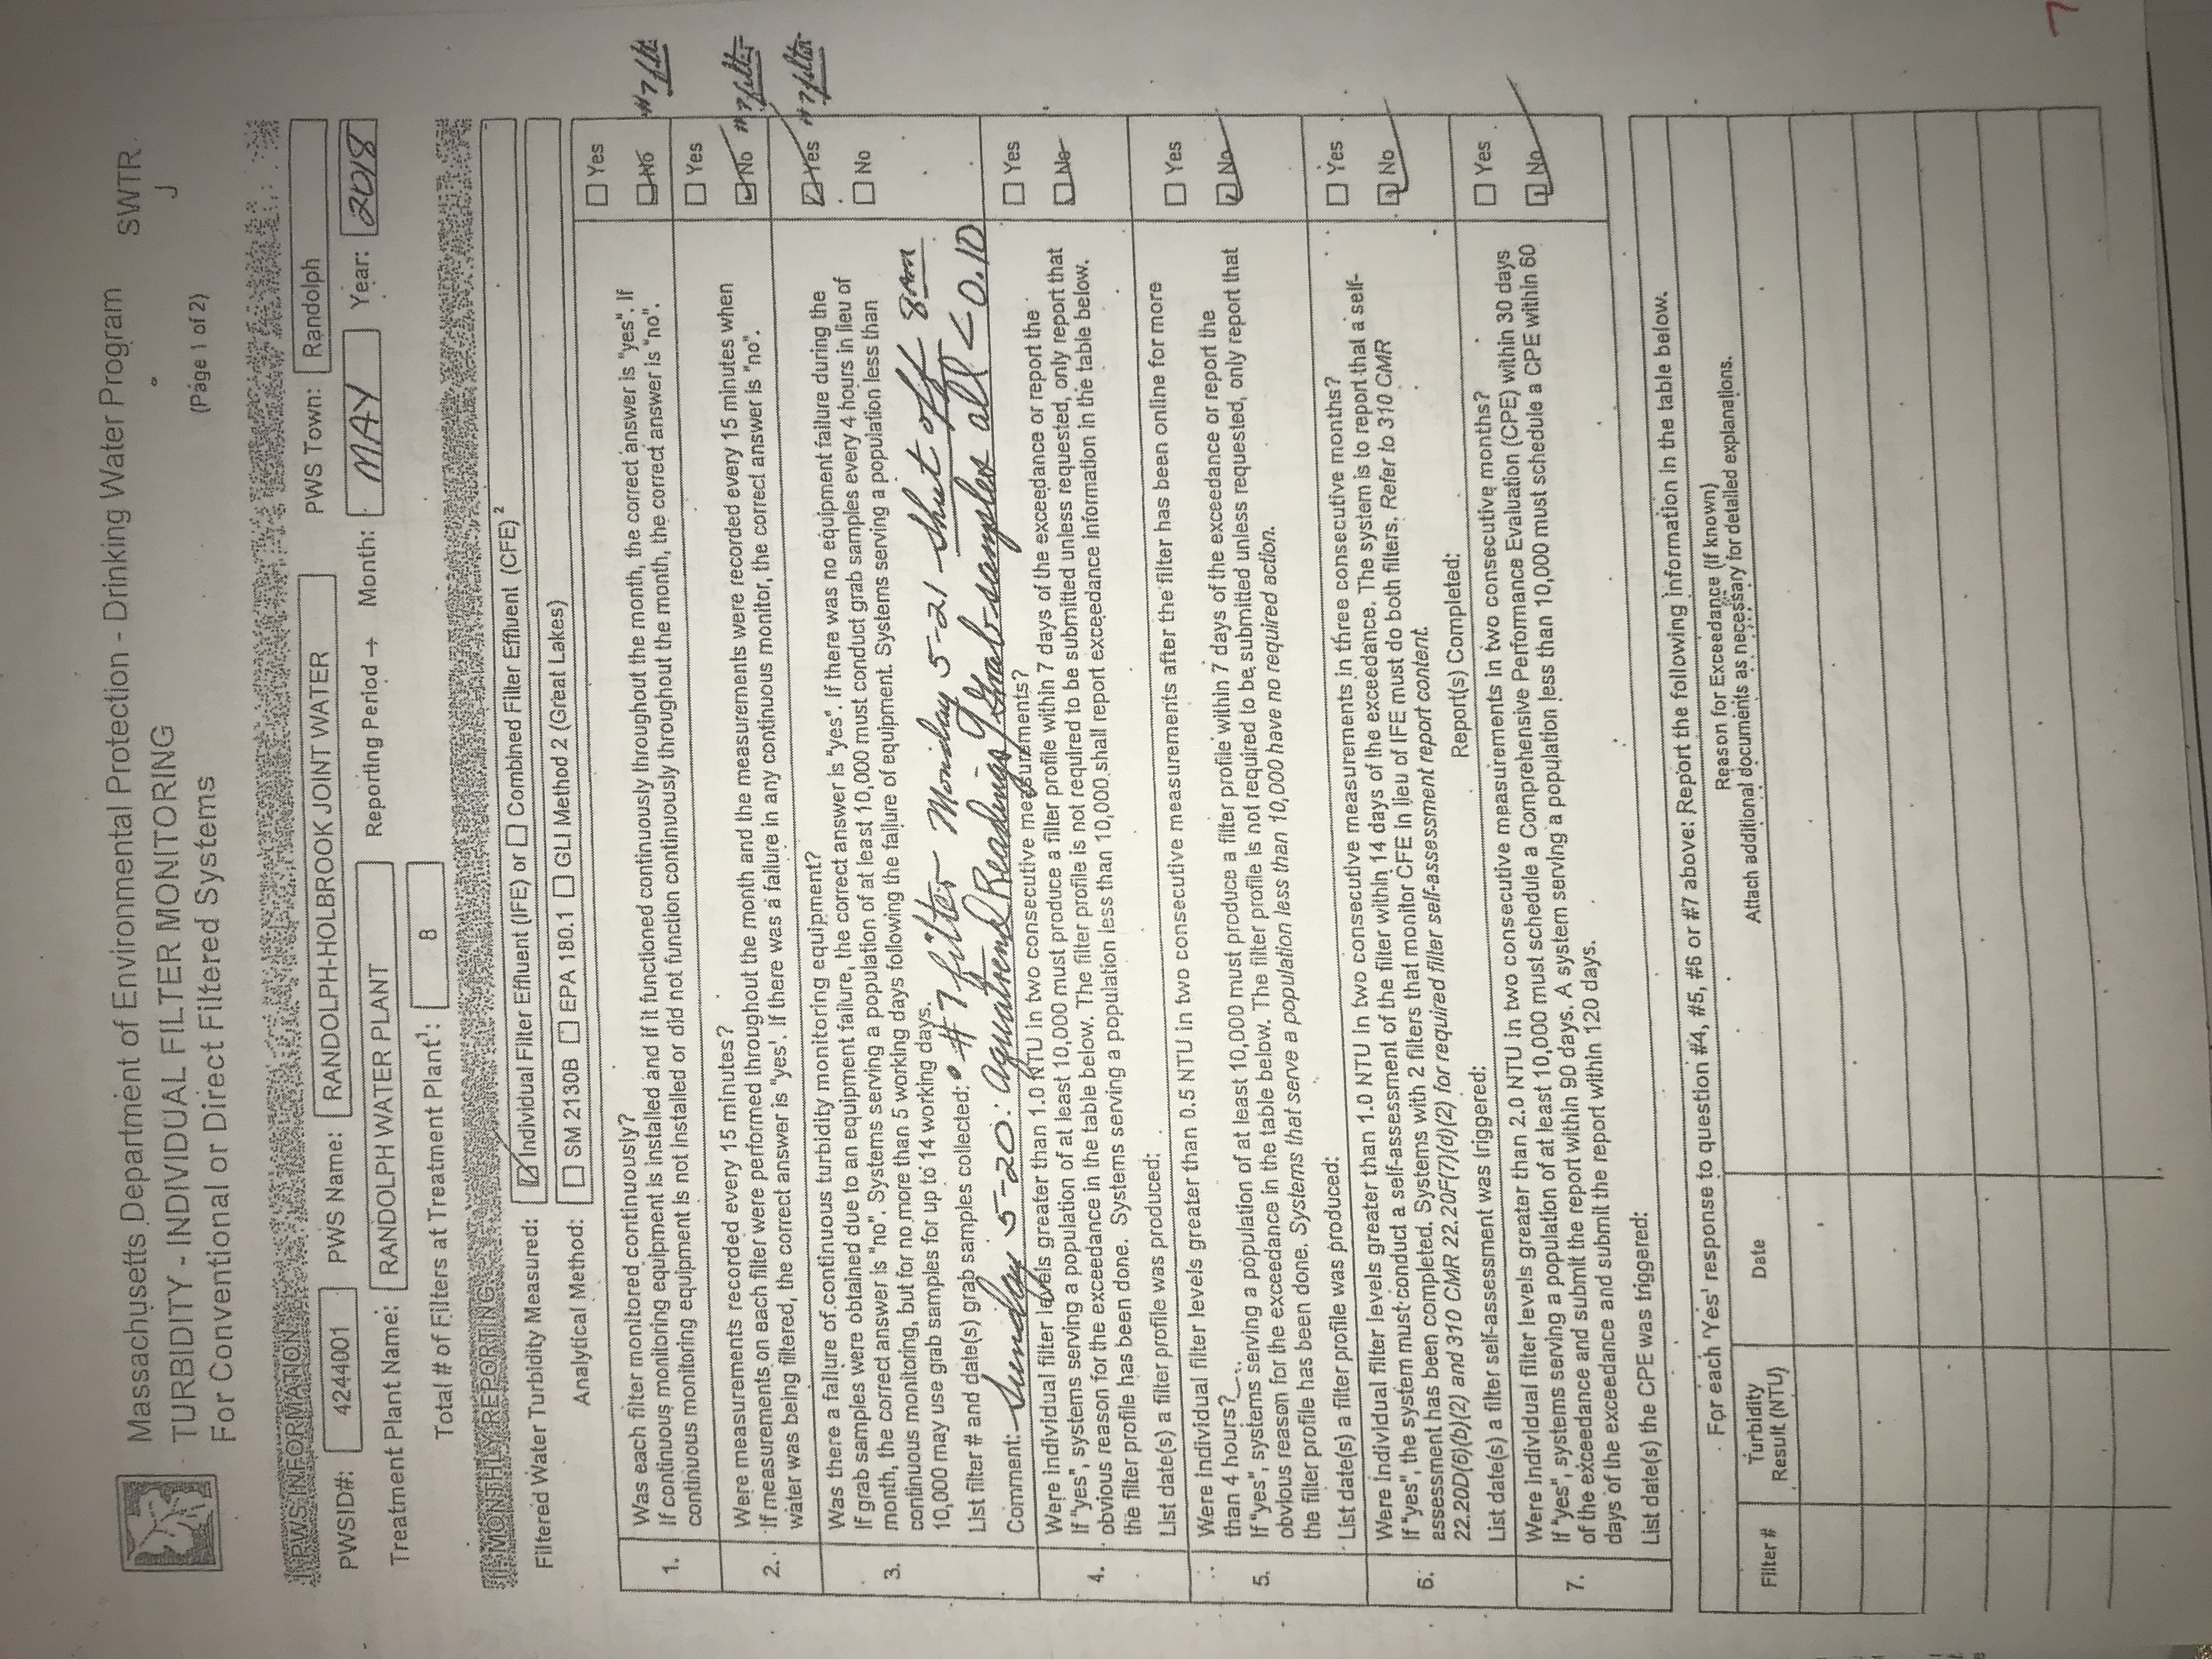
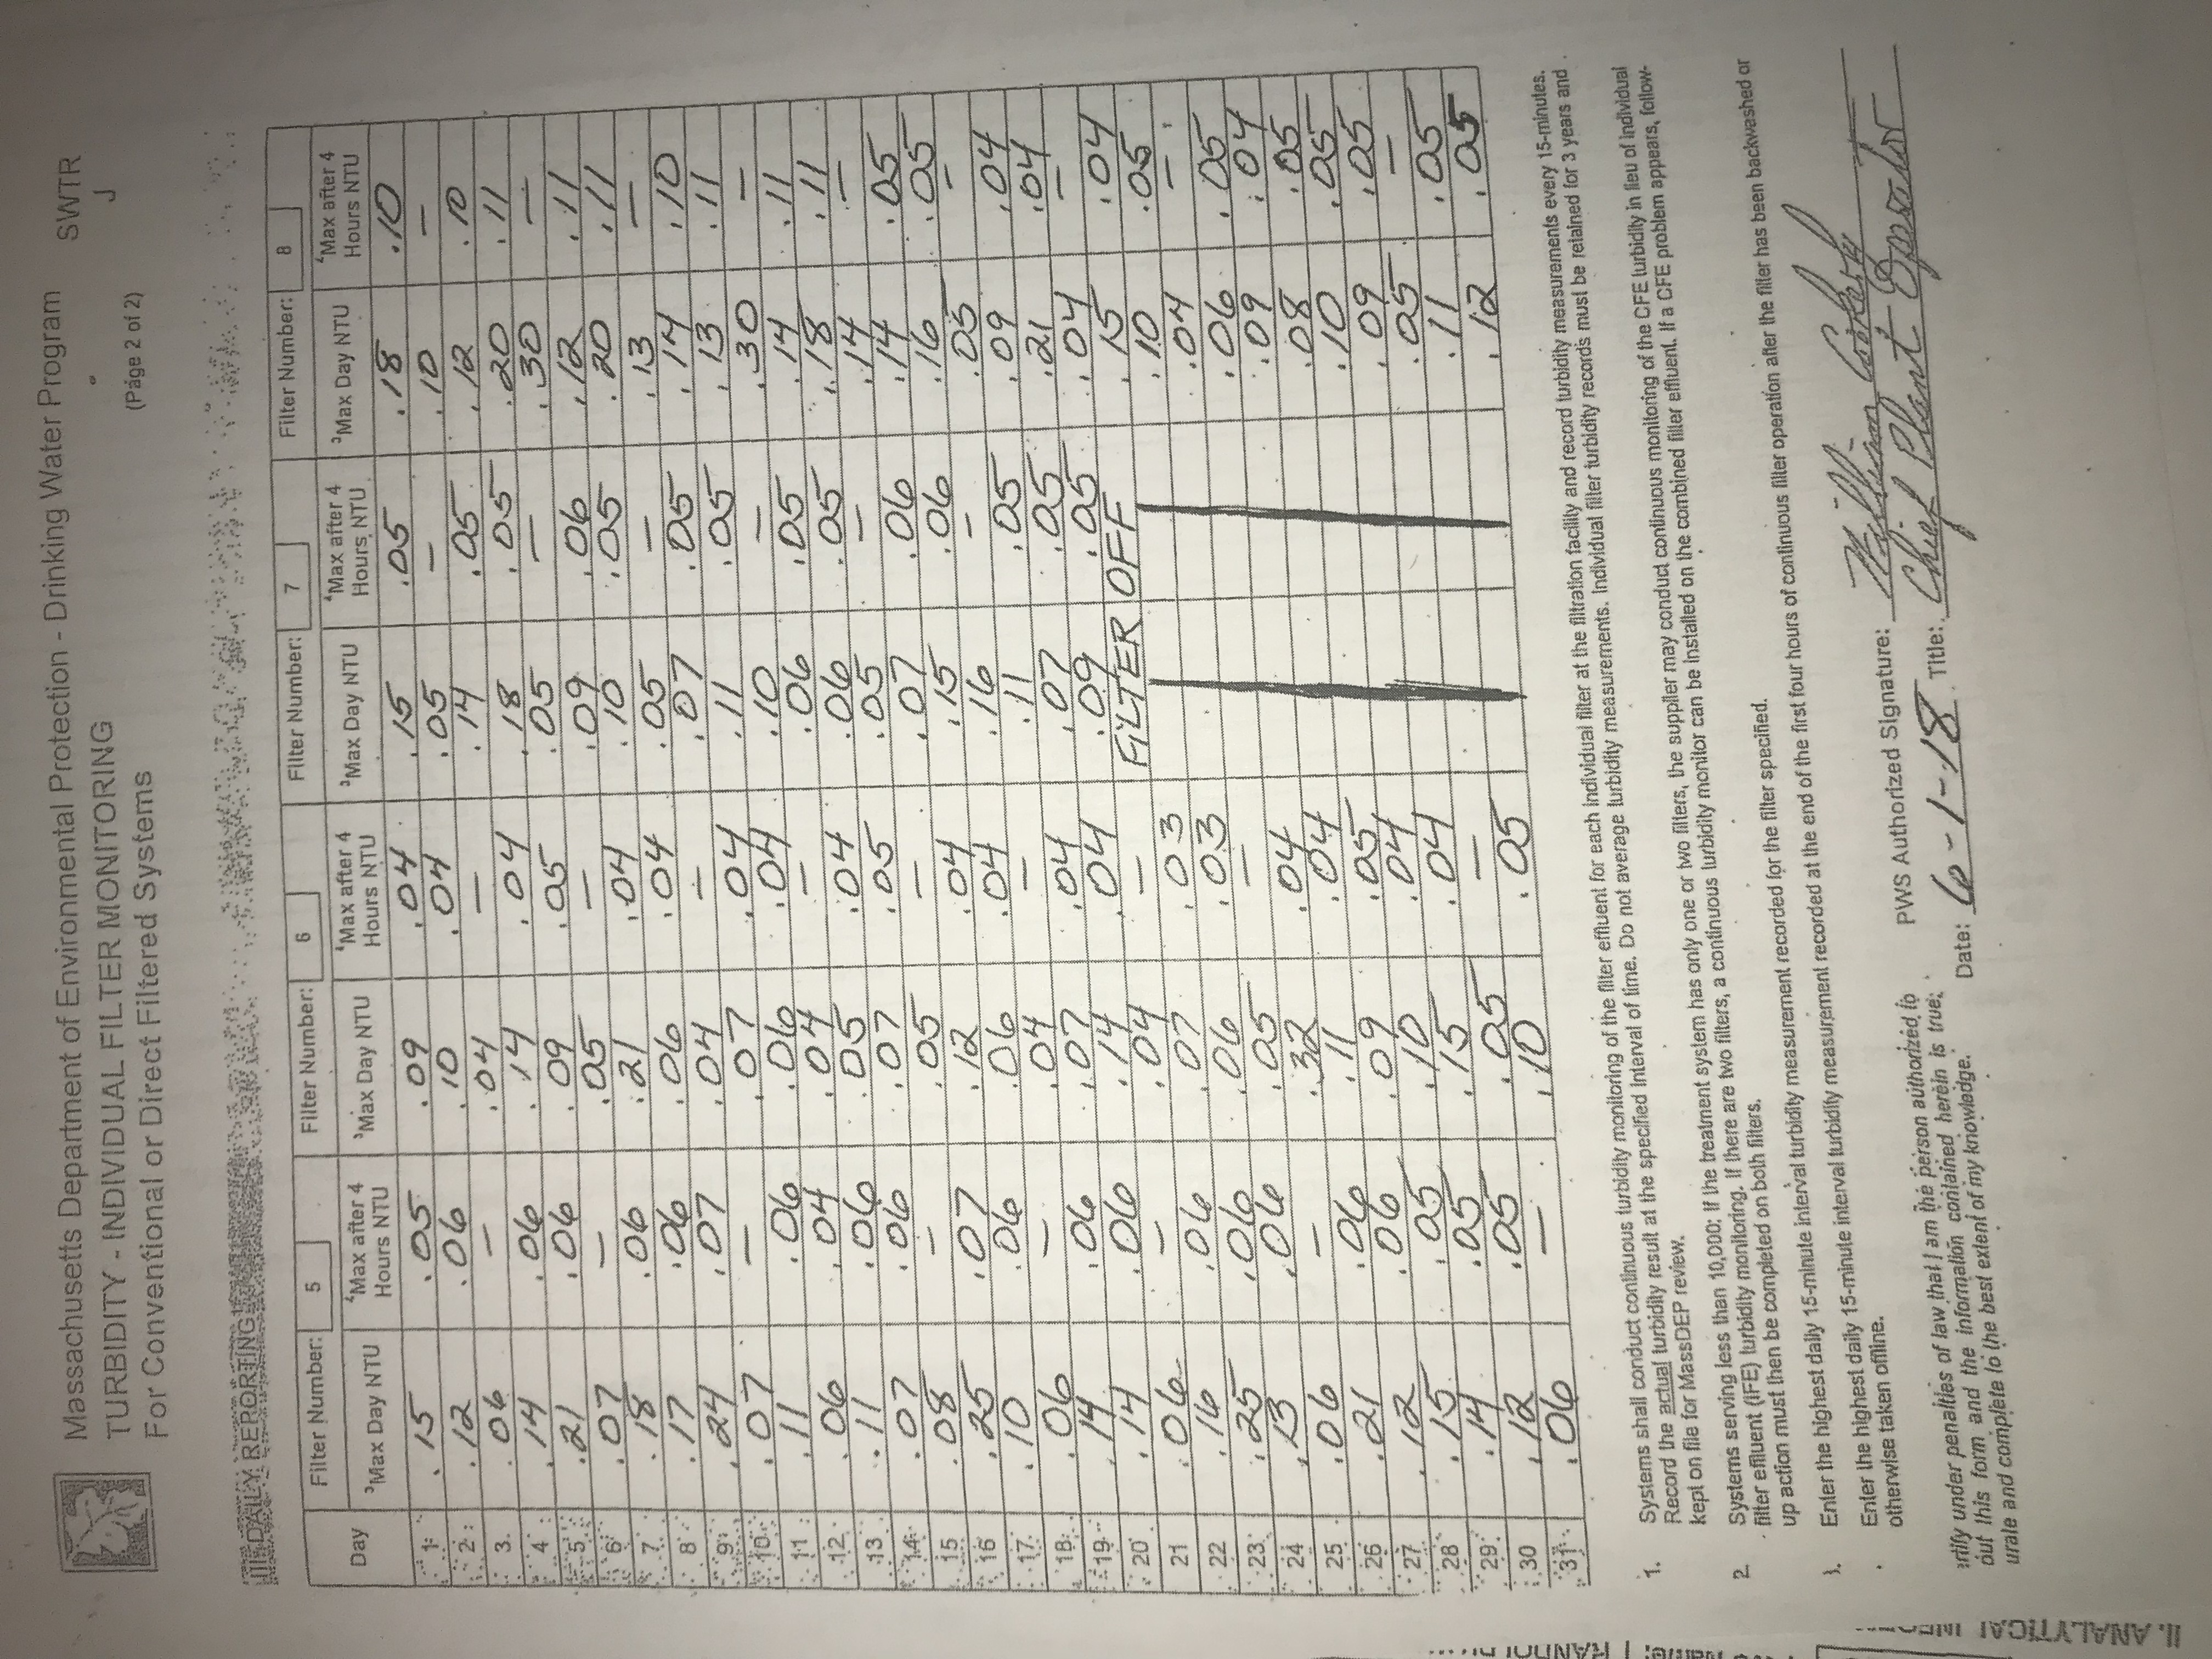
| Document 2226 | Turbidity | NTUs (Turbidity Units) | 0.03 NTU - 0.30 NTU | This is the daily turbidiy summary for the other 4 of our 8 different filters at the water treatment plant. The reason turbidity is so thoroughly measures is that it's unhealthy to drink turbid water. So the state requires testing a LOT for turbidity, and requires that, if 1.0 NTU is exceeded, that a public notice get sent out. Notice on this report that filter #7 got turned off for over a week (as summarized in Document 2224). That's the level of detail required -- because turbidity matters! |
| In the water distribution system: |
|---|
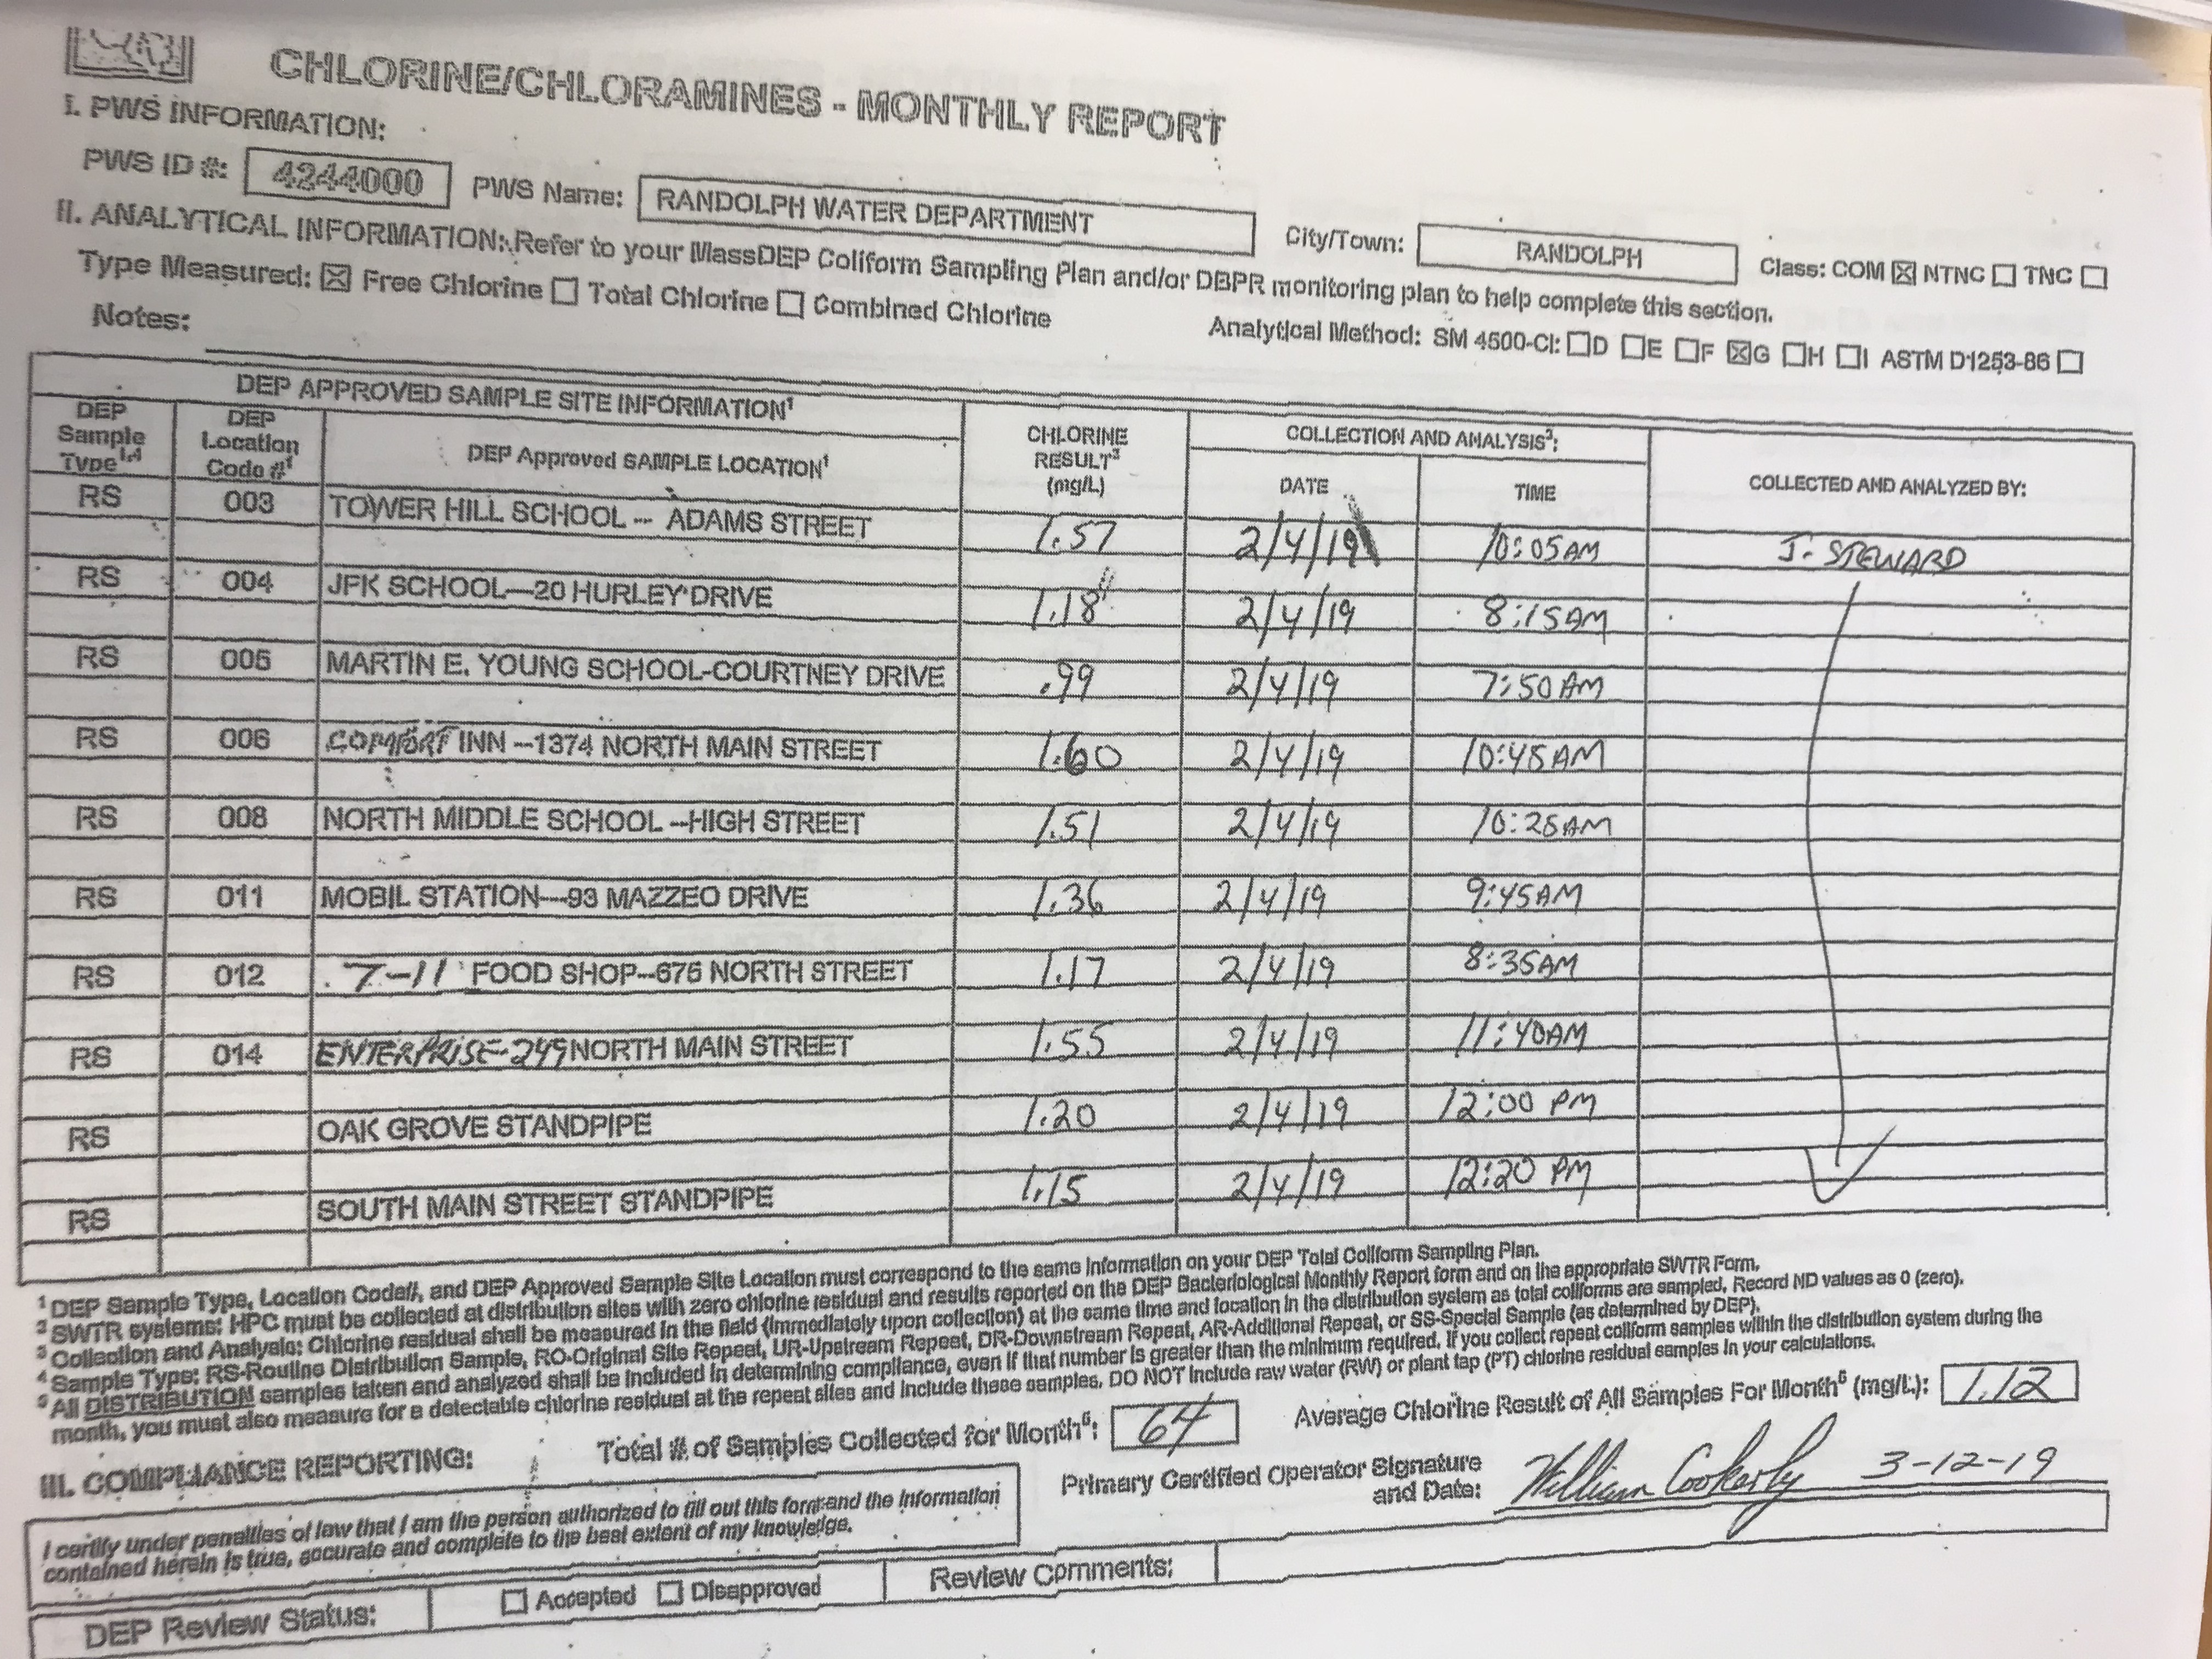
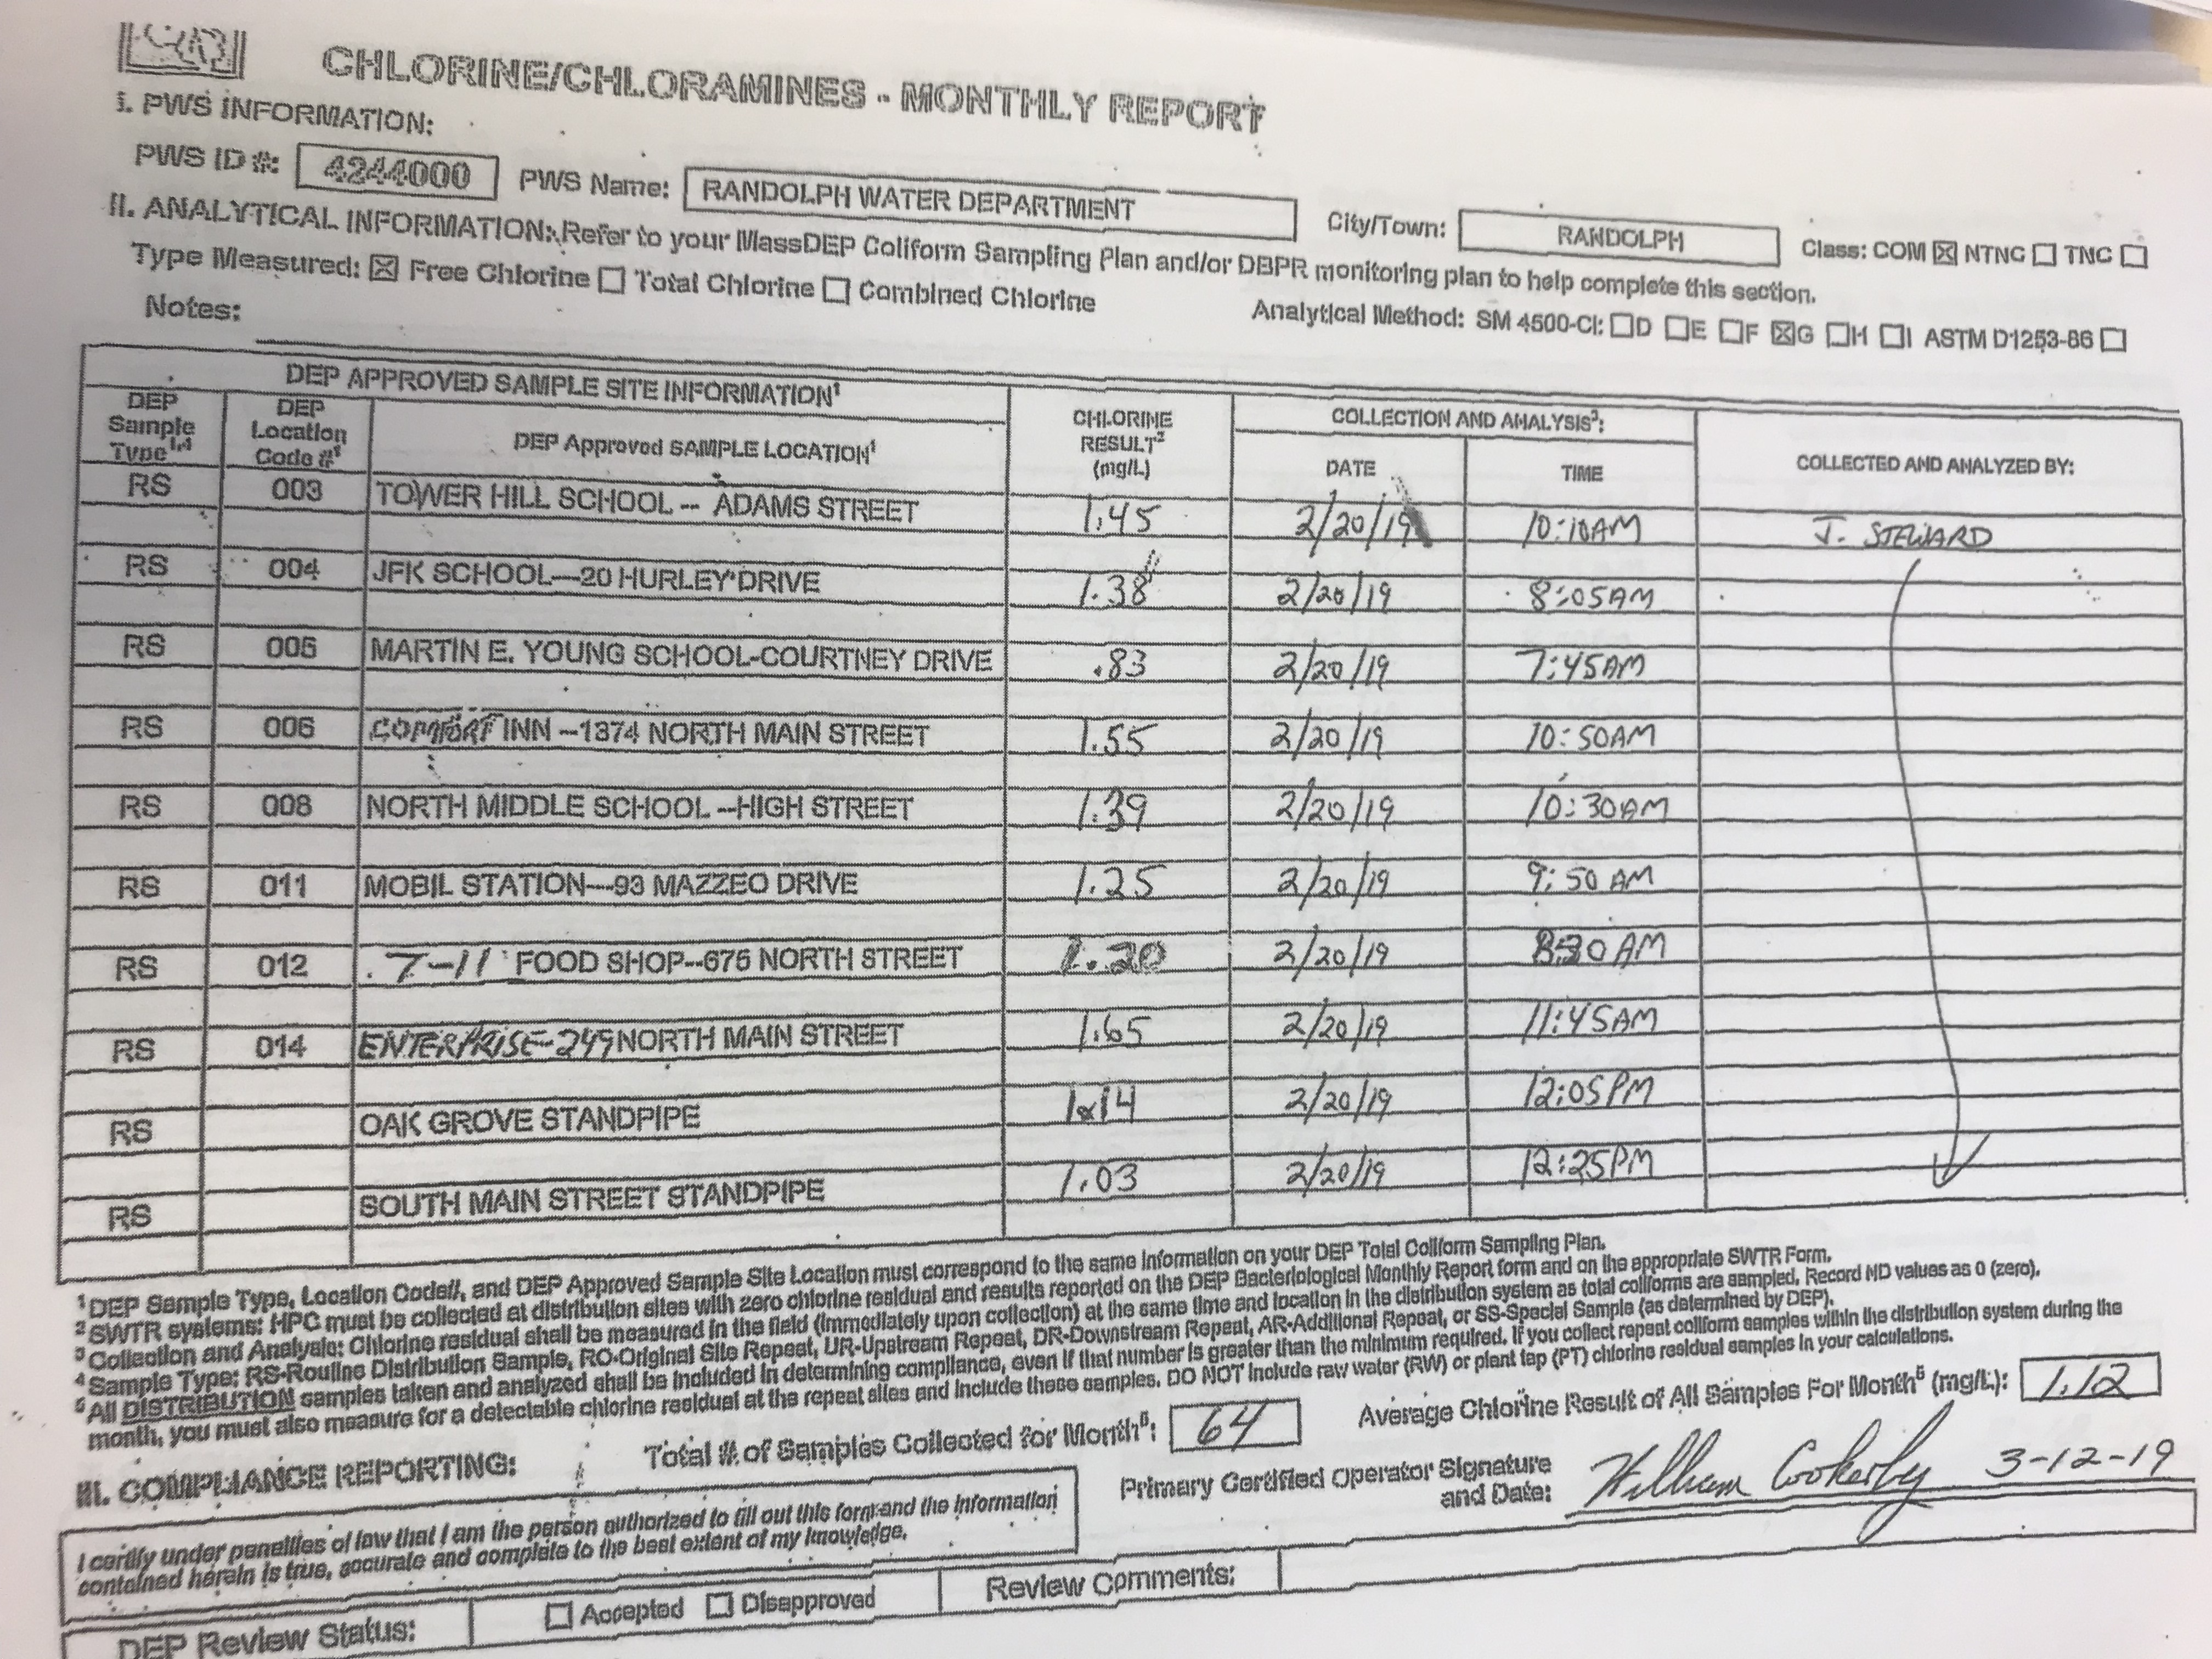
| Document 2119 | Chlorine/Chloramines/FC | 0.99-1.60 mg/L | 2/4/19 | Adams Street; JFK School; Young School; Mazzeo Drive; 6 others 0.99-1.57 mg/L FC measures "free chlorine", which is the residual disinfectant left in the distribution system (chlorine is added at the water treatment plant; the goal is to have just a little left at the tap). Allowed range is "> 0.5 mg/L" TK 2018 report says "max 4ppm for TC" (TC=FC+CC) |
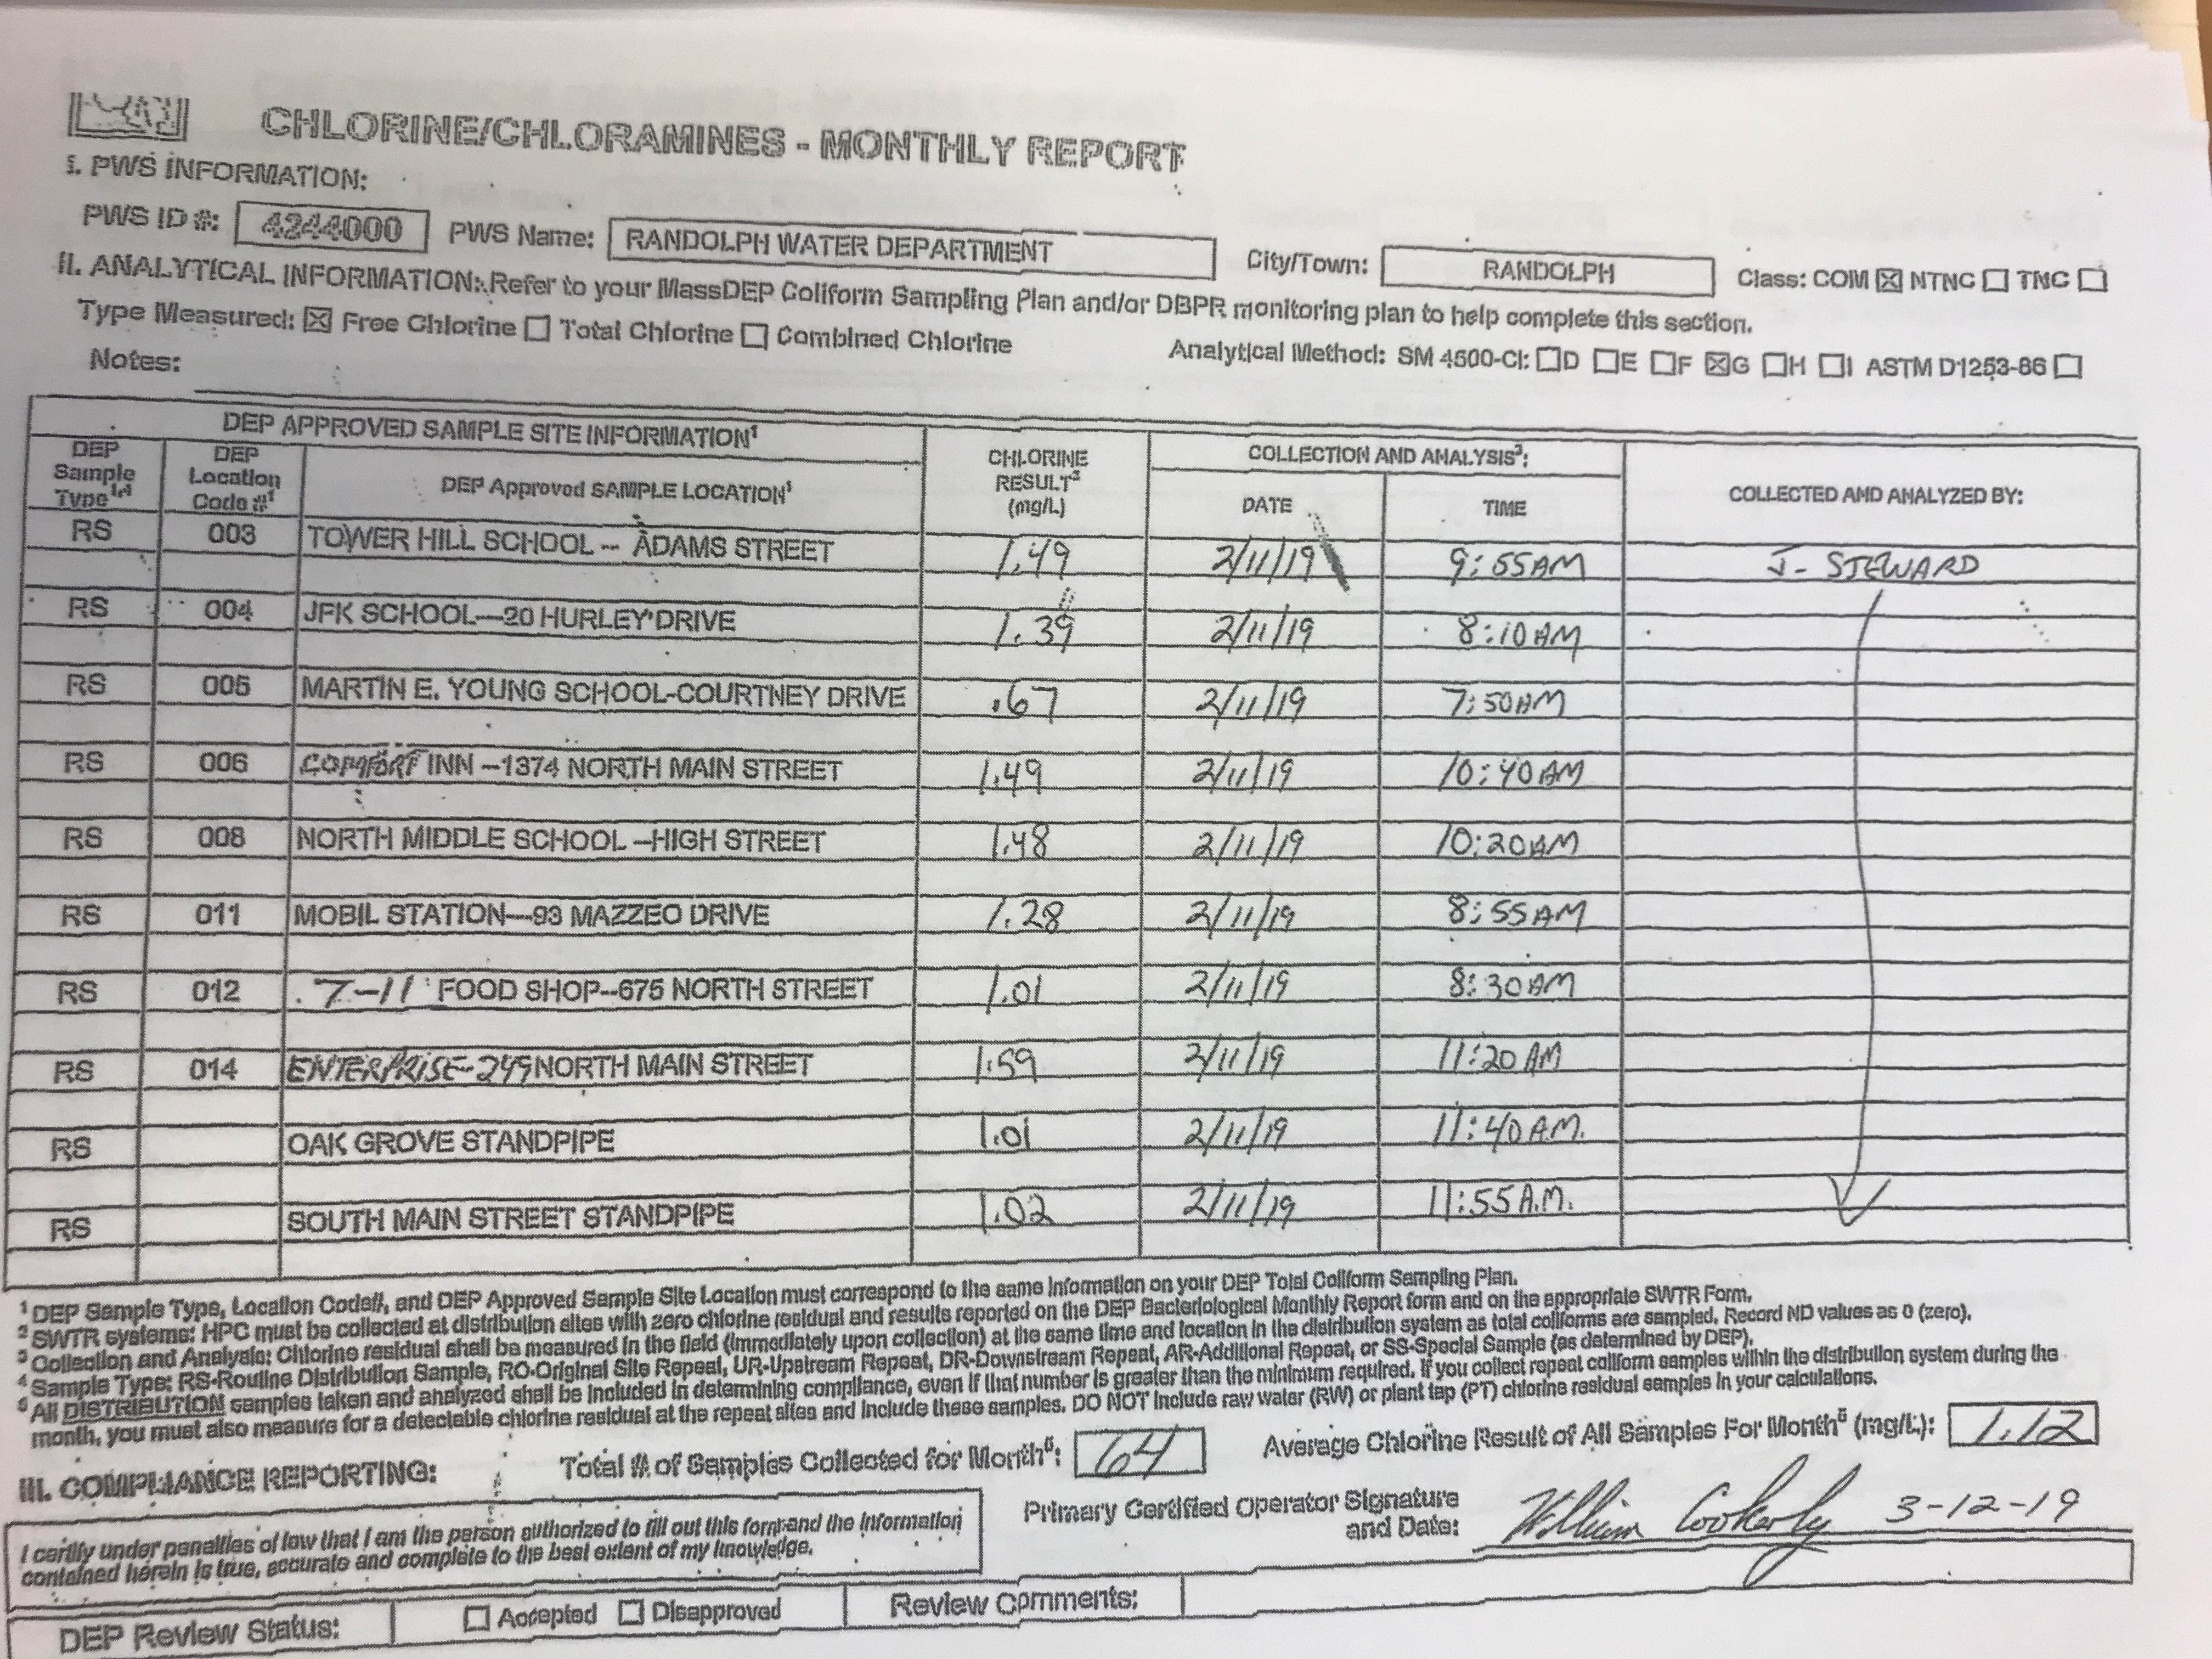
| Document 2120 | Exact same as IMG_2119.JPG except on 2/11/19 (same 10 locations the next week) | 0.67-1.59 mg/L |
| Document 2121 | Exact same as IMG_2119.JPG except on 2/20/19 (same 10 locations two weeks later) | 0.83-1.65 mg/L |
| PDF 1 | Collection of grab samples and composite discharge reports from Analytical Balance Corp. to DPW Director Richard Brewer(18 pages) |
| PDF 2 | Full water quality data set for summer 2019, including Turbisity reports at water treatment plant, and grab samples in distribution system (no turbidity reports in distribution system) 41 pages |
| PDF 3 | FUll report set for one month, September 2018 (11 pages) |
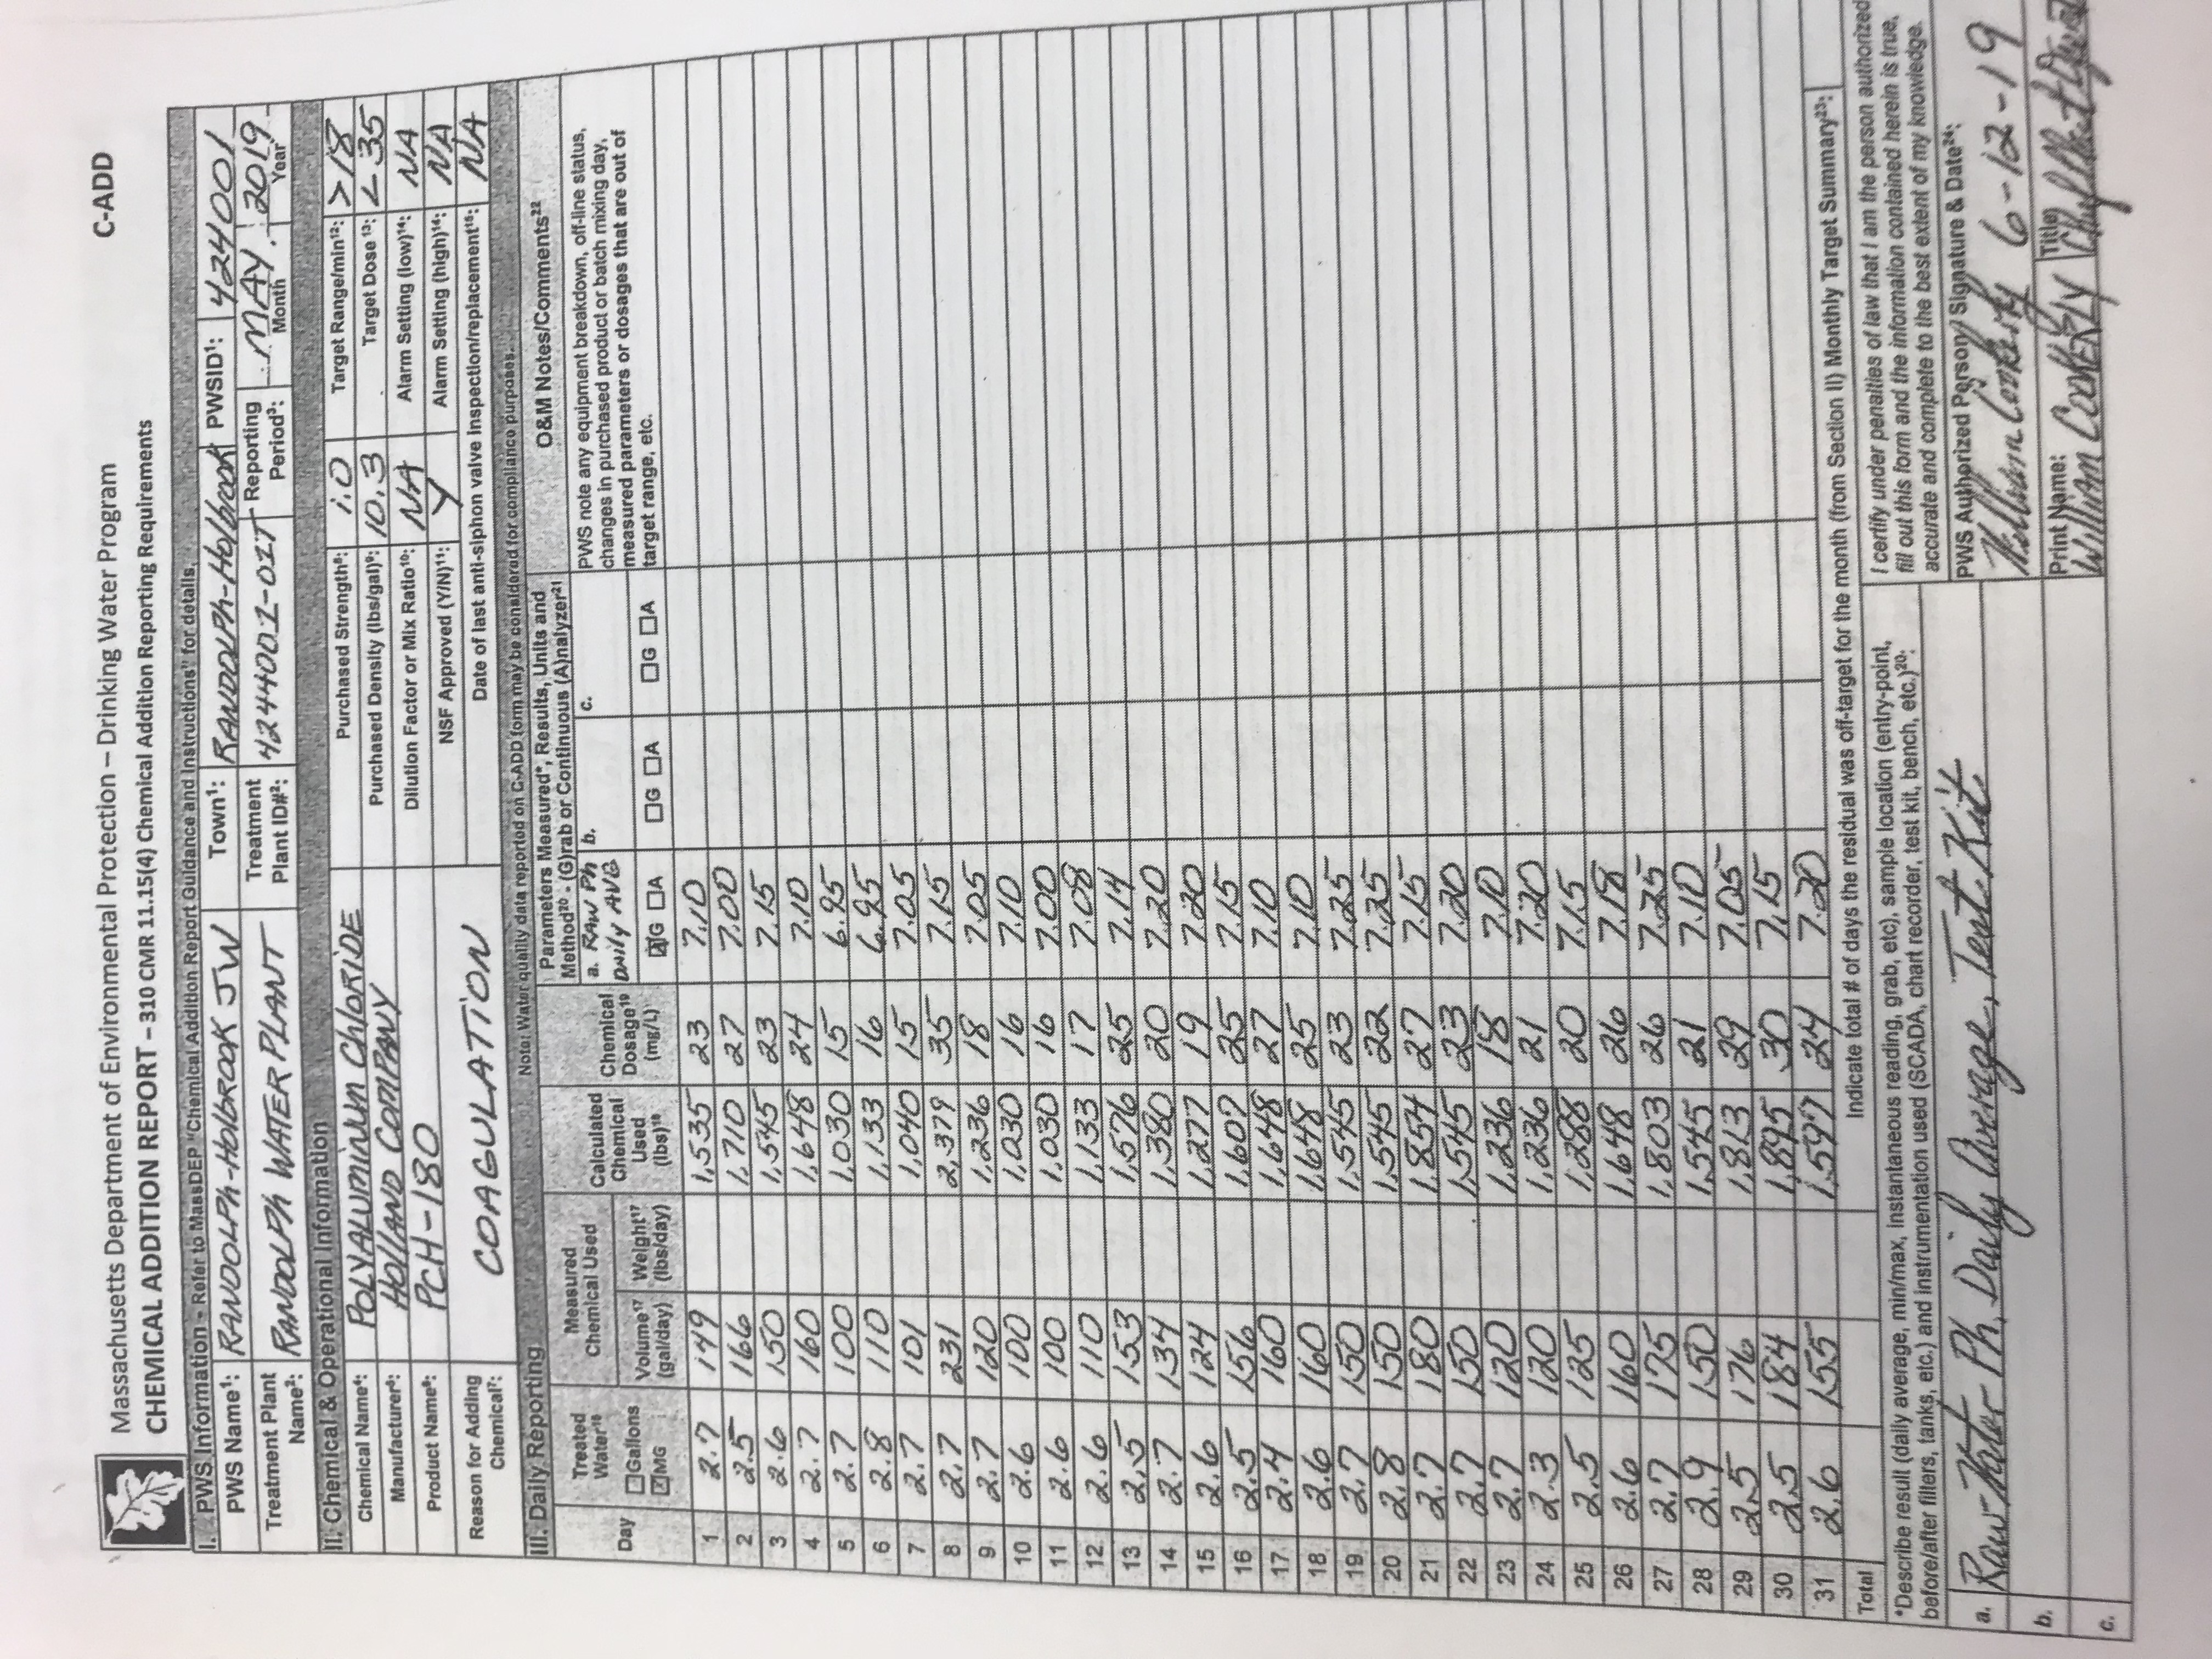
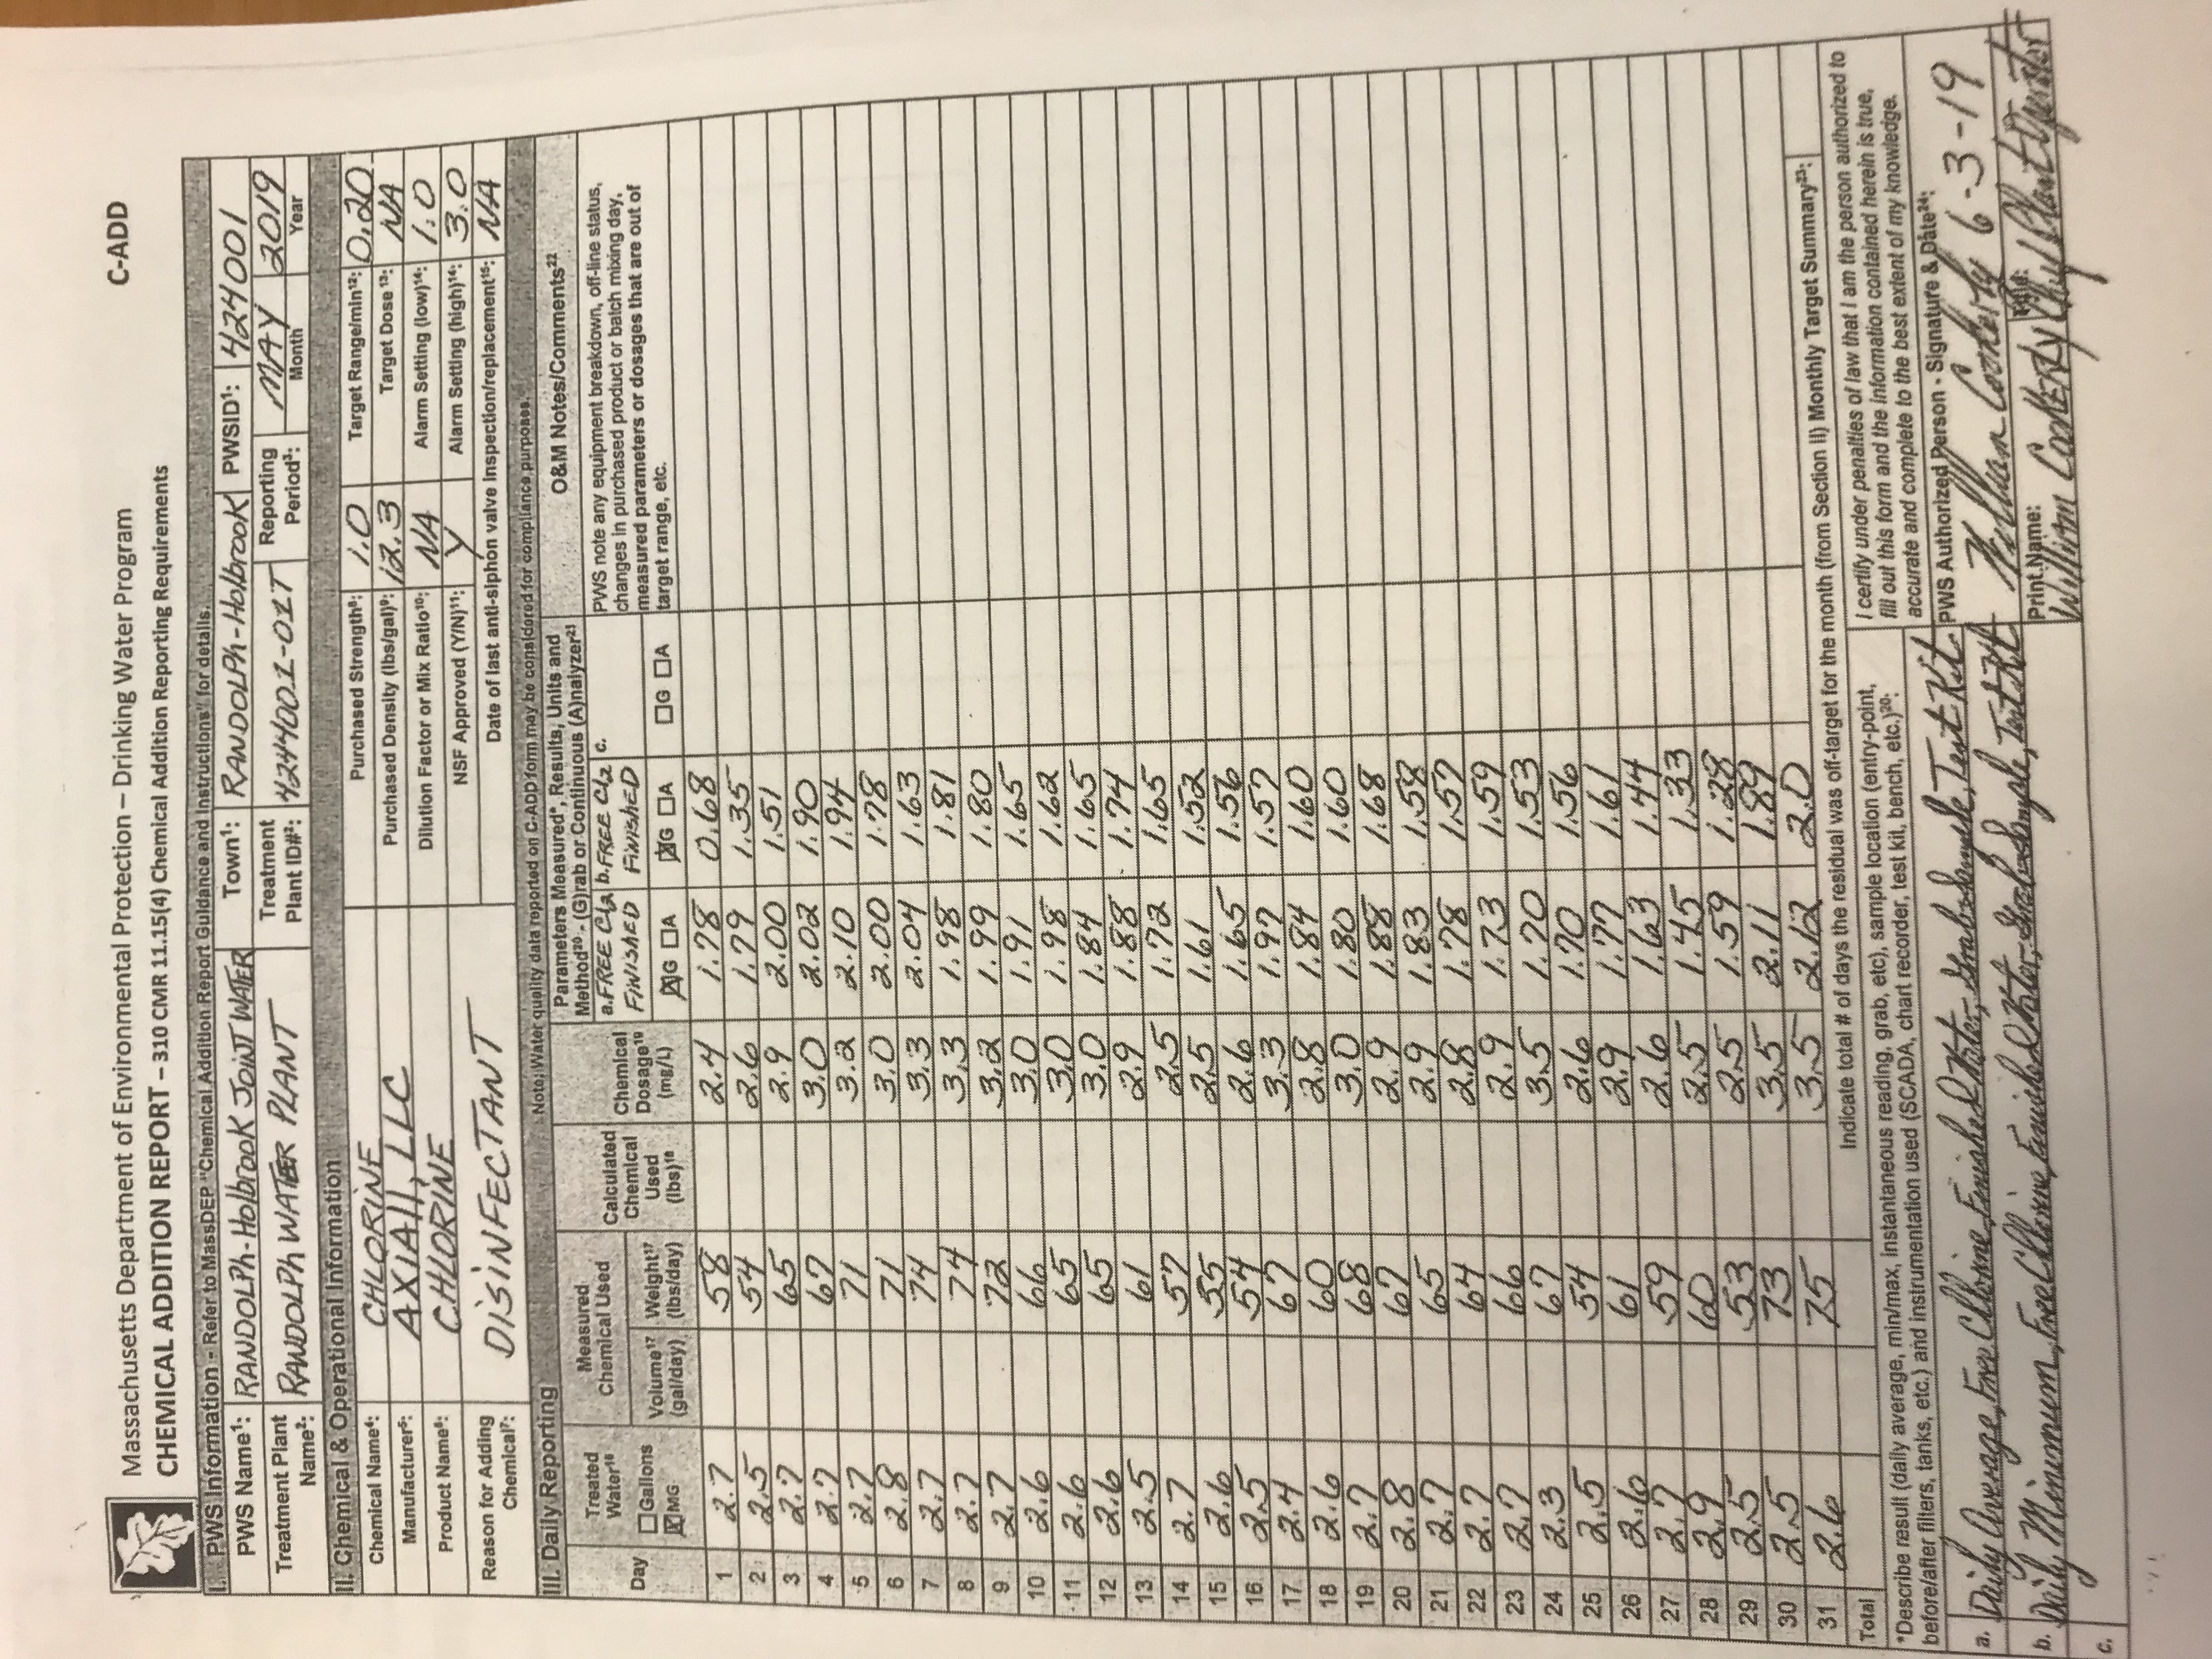
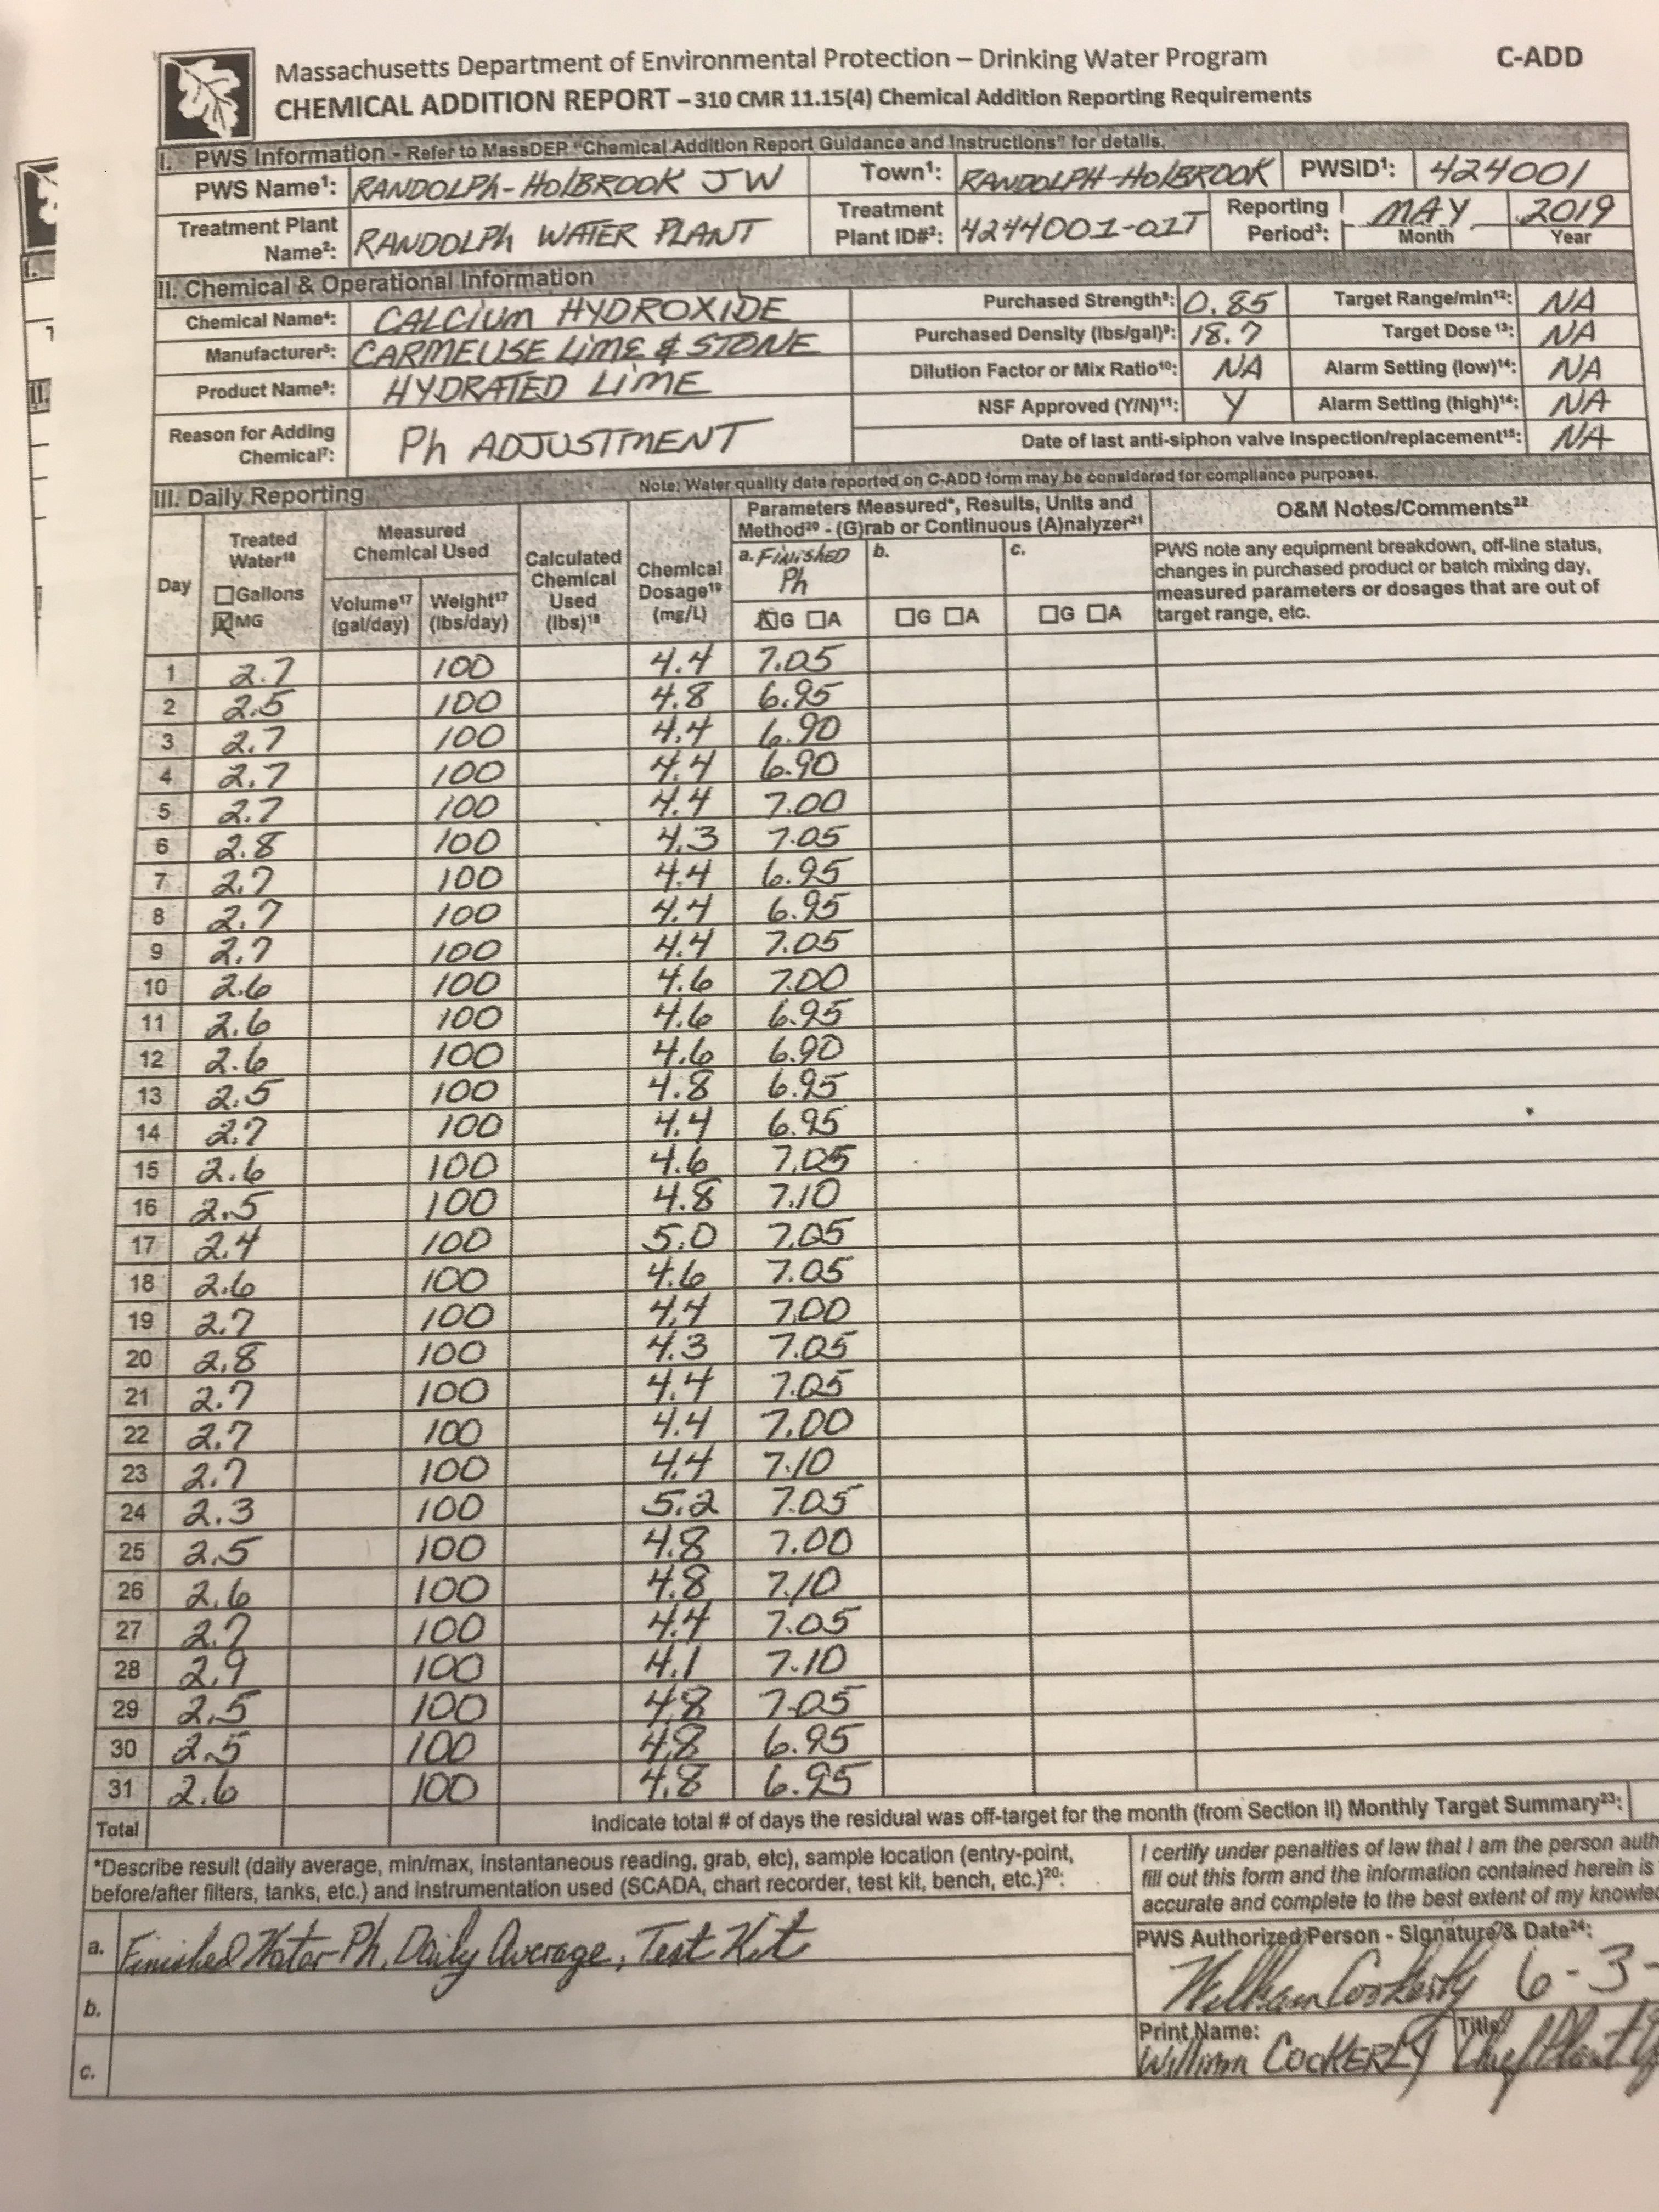
| Input at water treatment plant: |
|---|
| Document 2124 | Polyaluminum chloride (coagulant) |
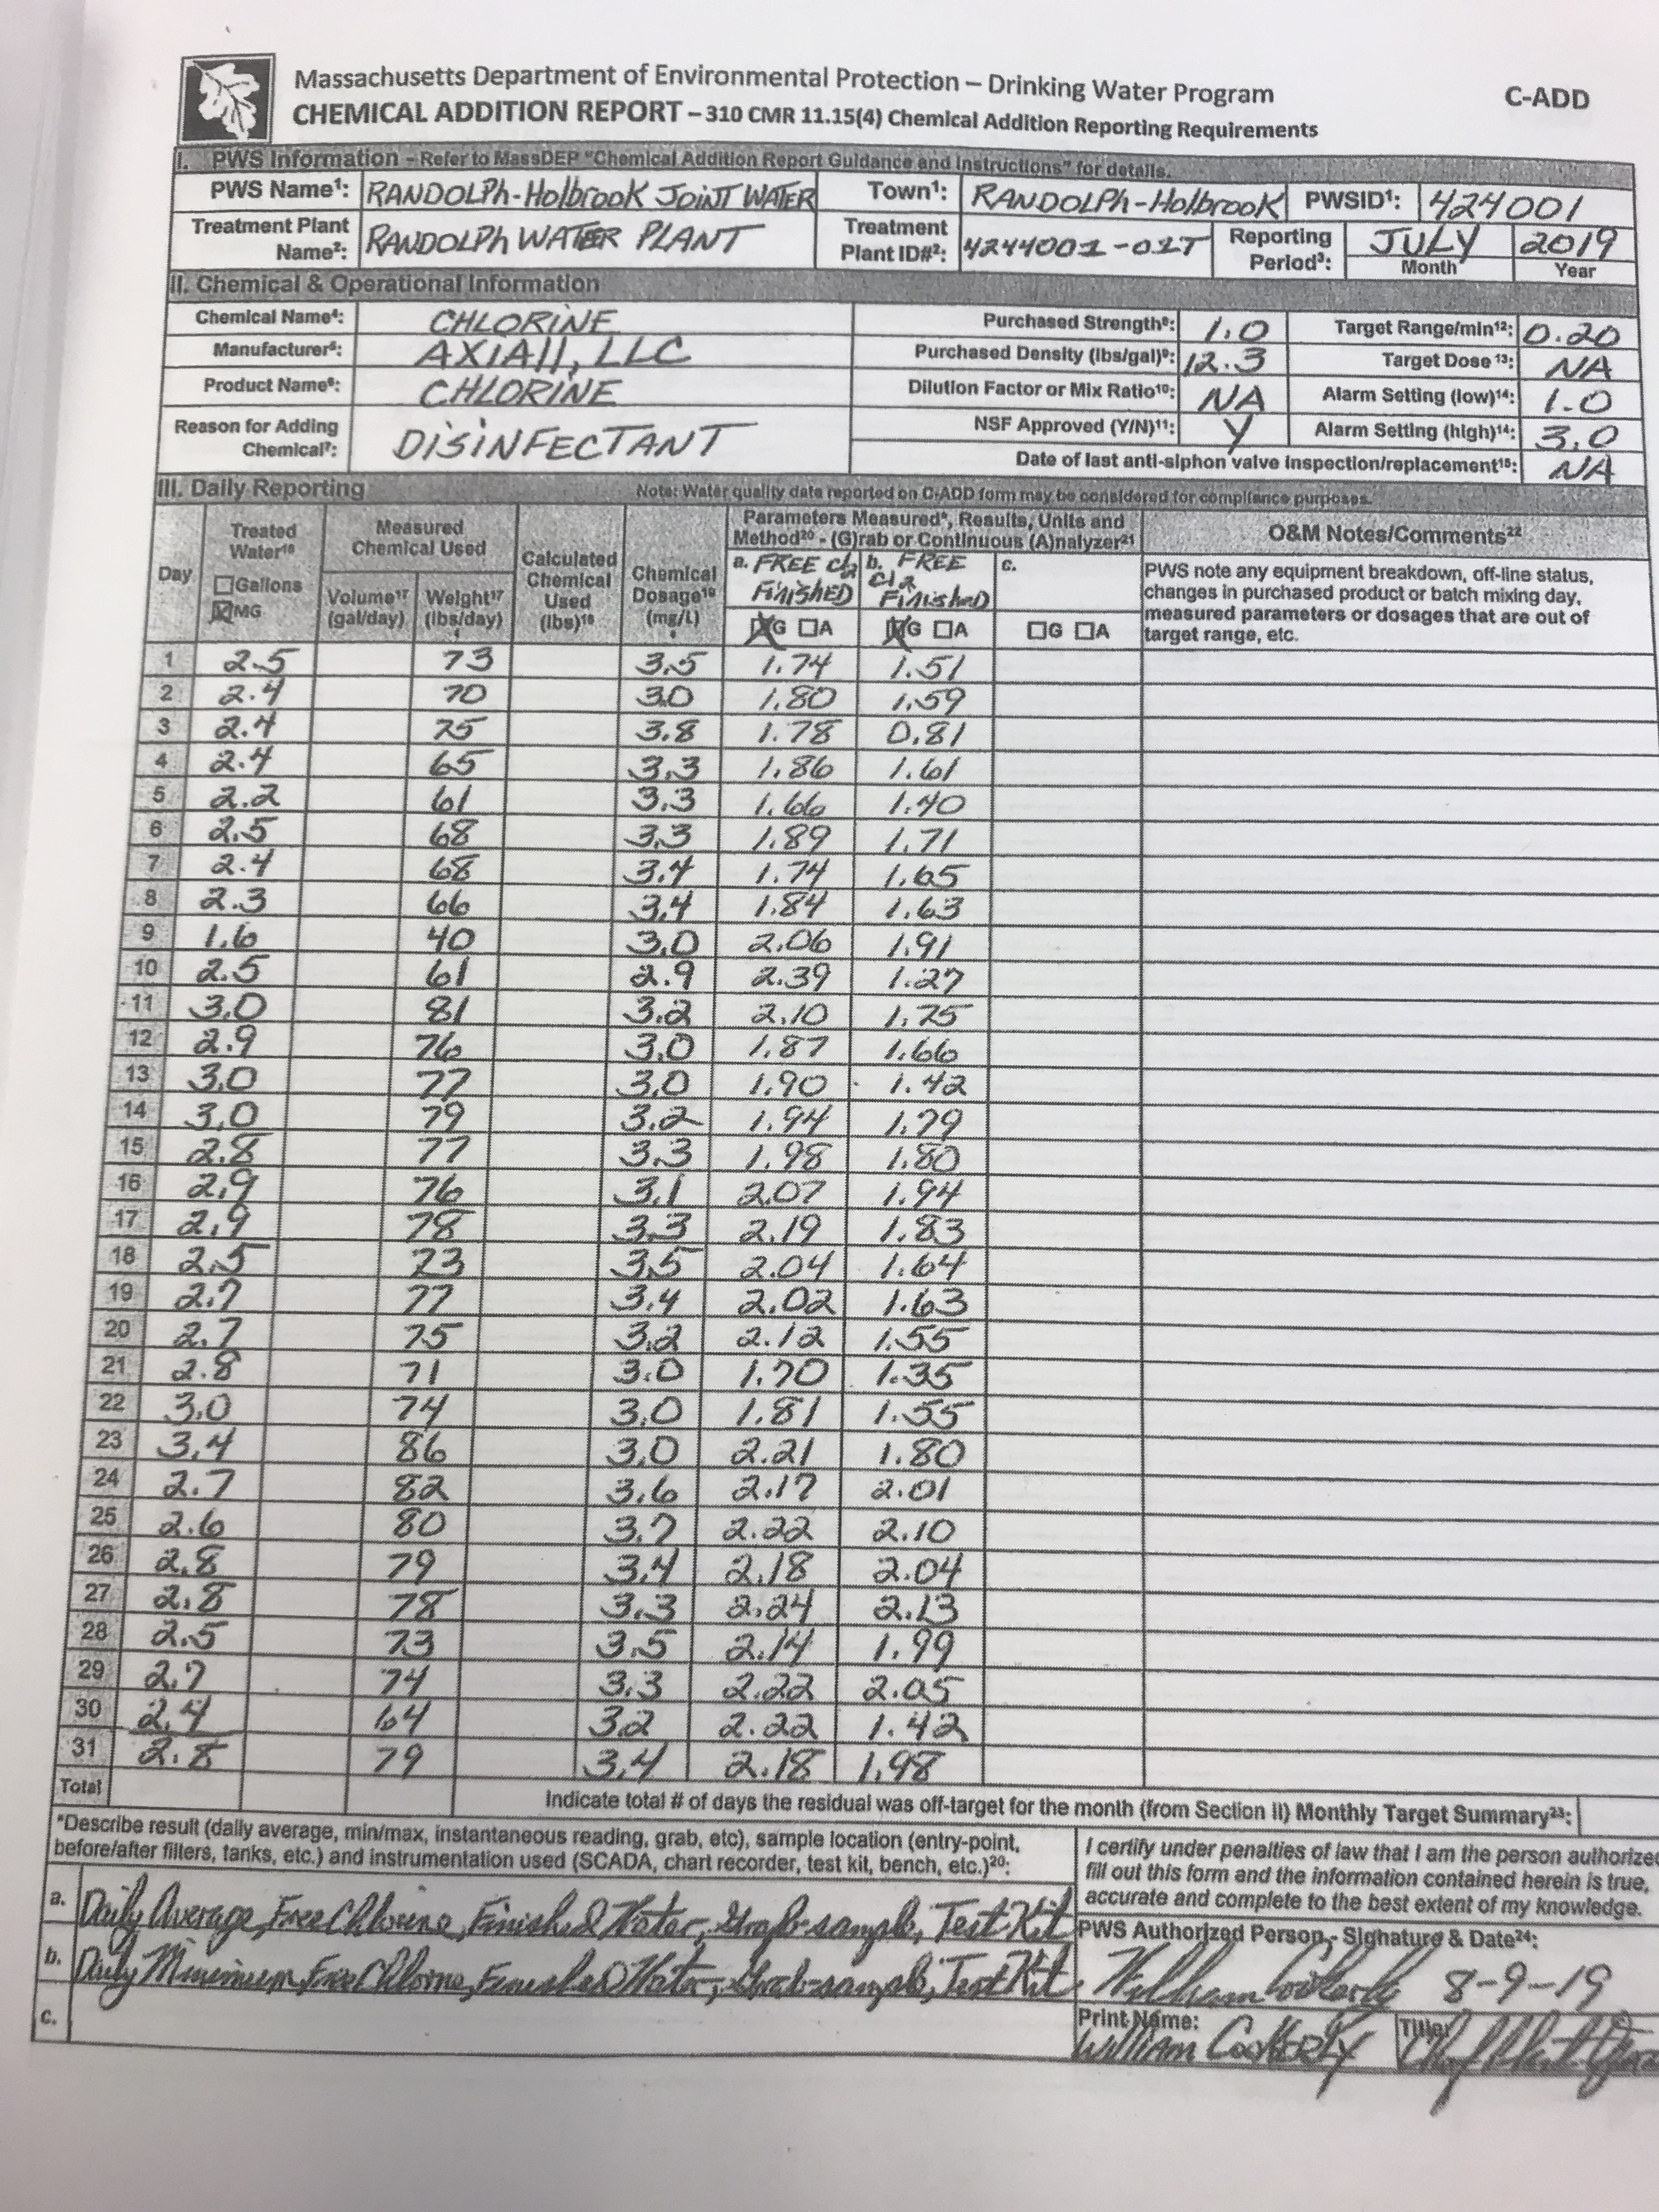
| Document 2125 | Chlorine (disinfectant) |
| Document 2126 | Hydrated lime (acidity adjustment) |
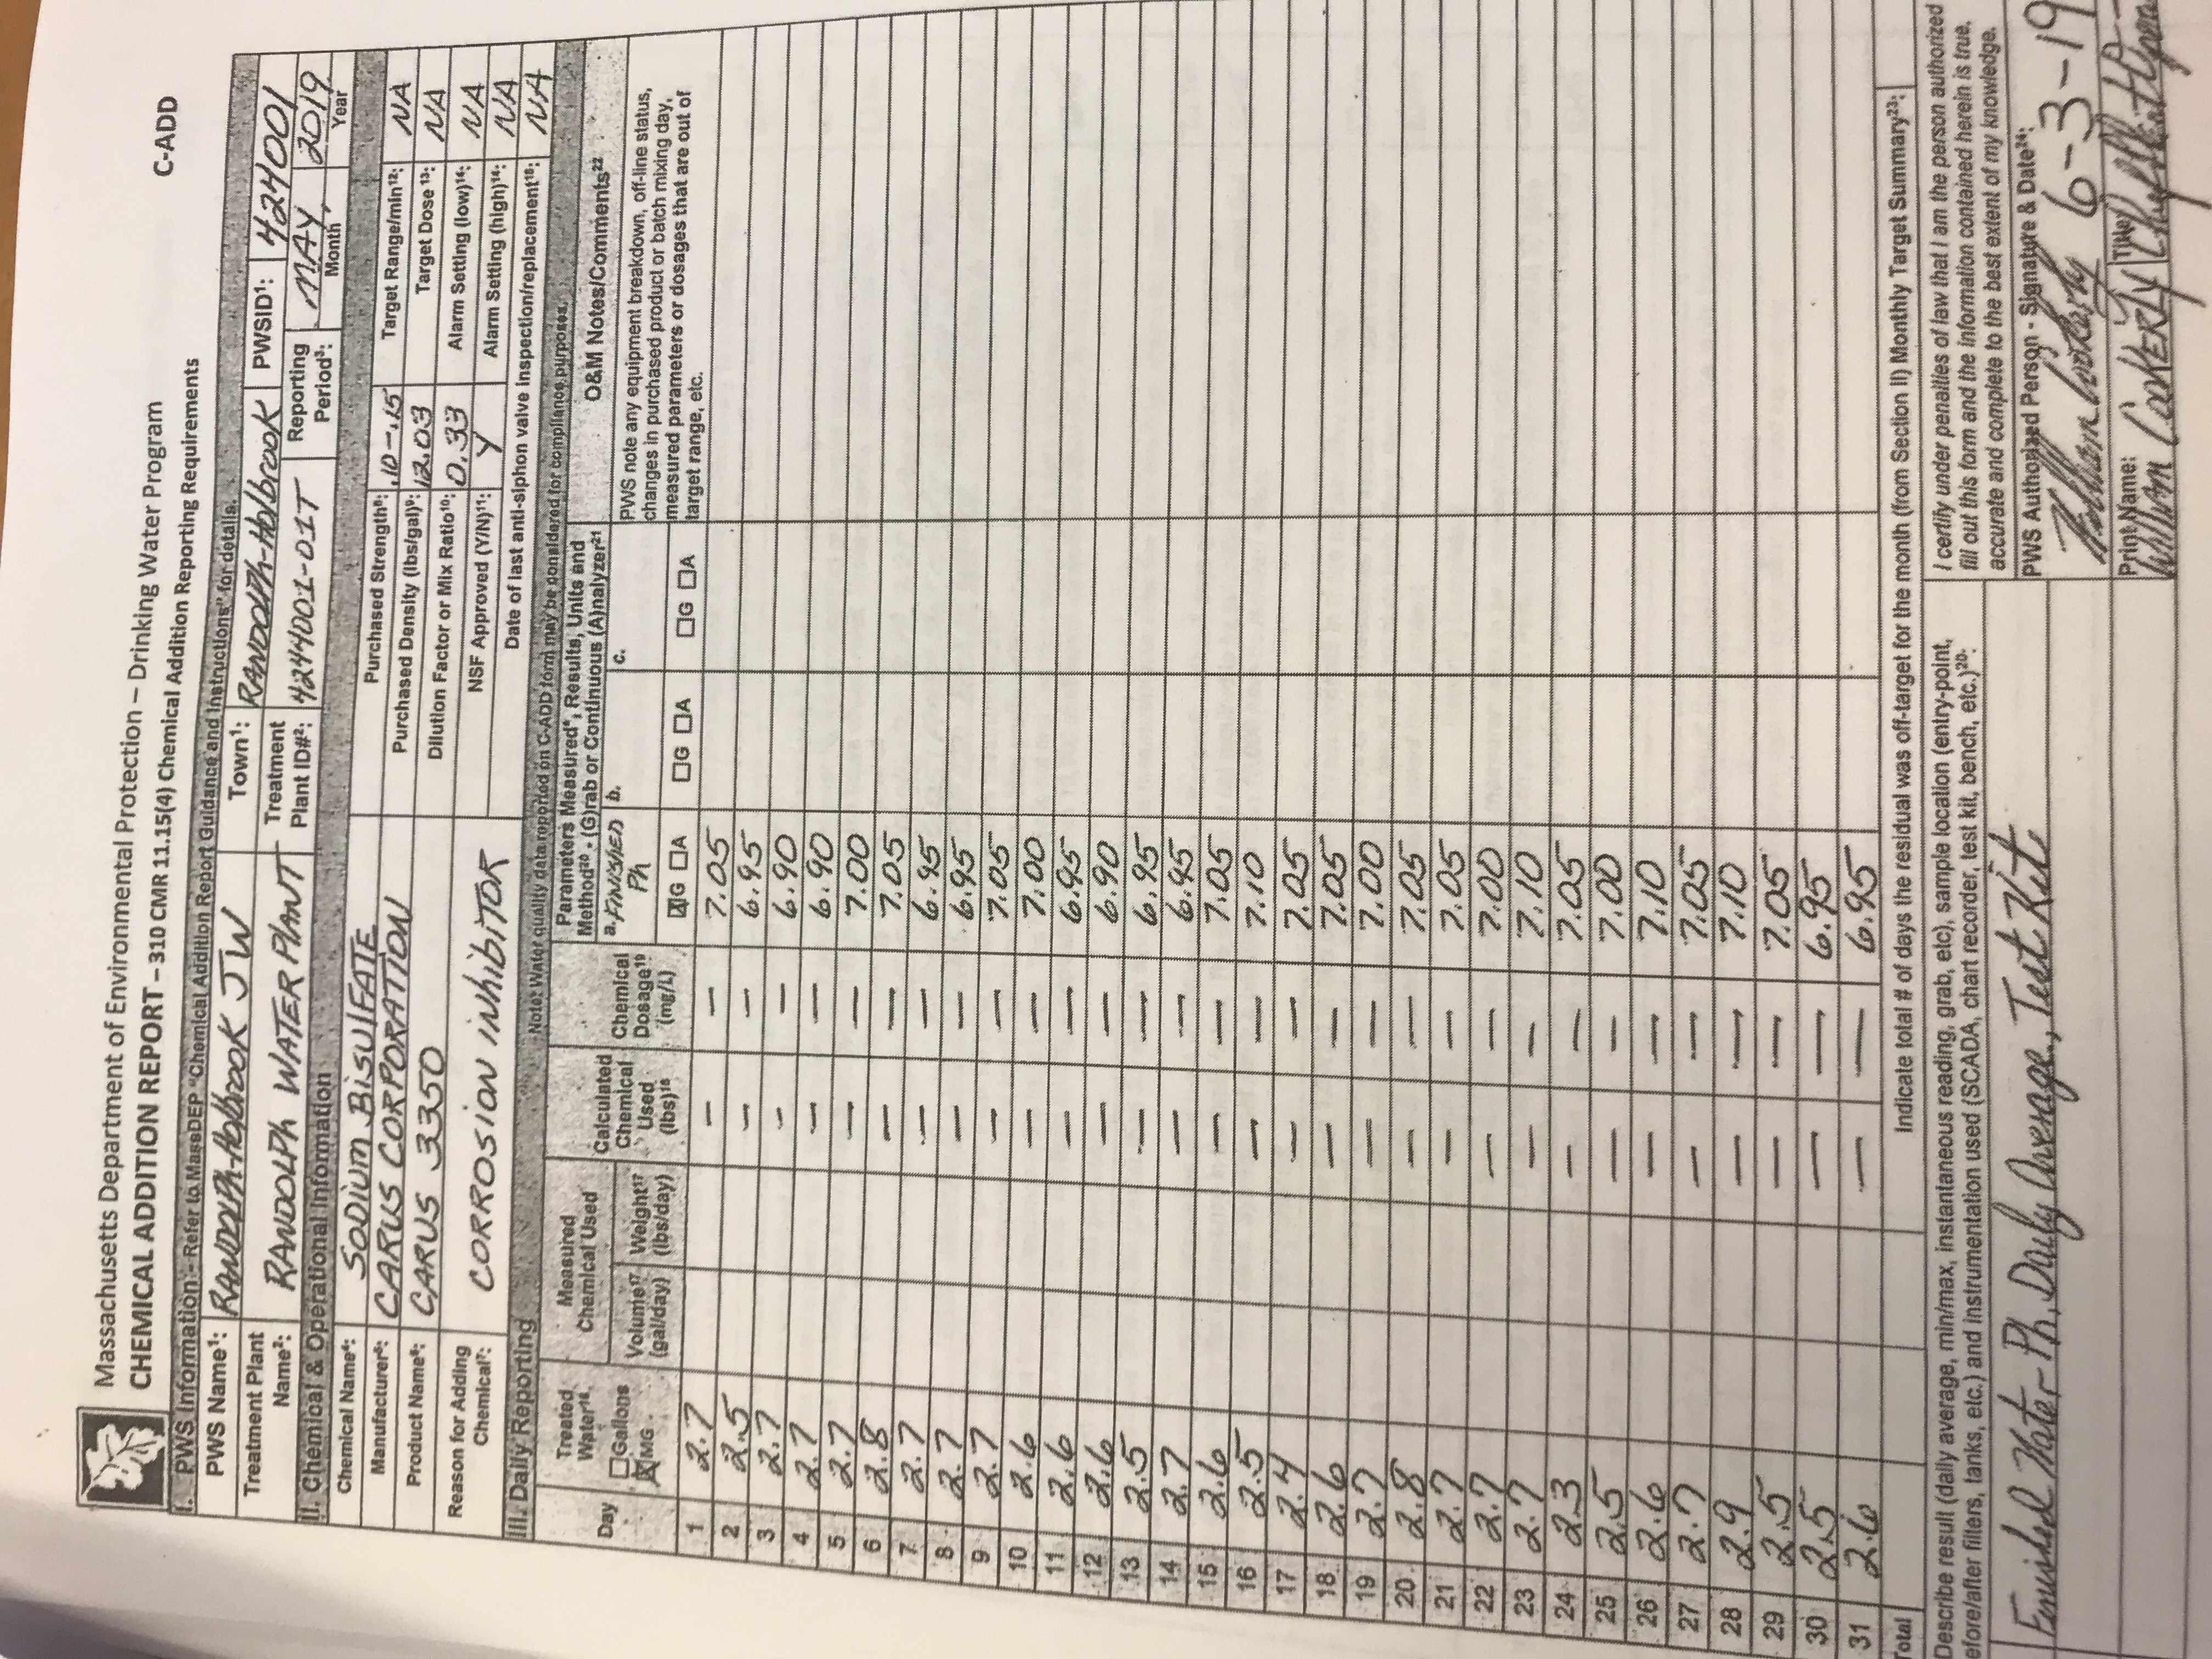
| Document 2127 | Sodium Bisulfate (corrosion inhibitor) |
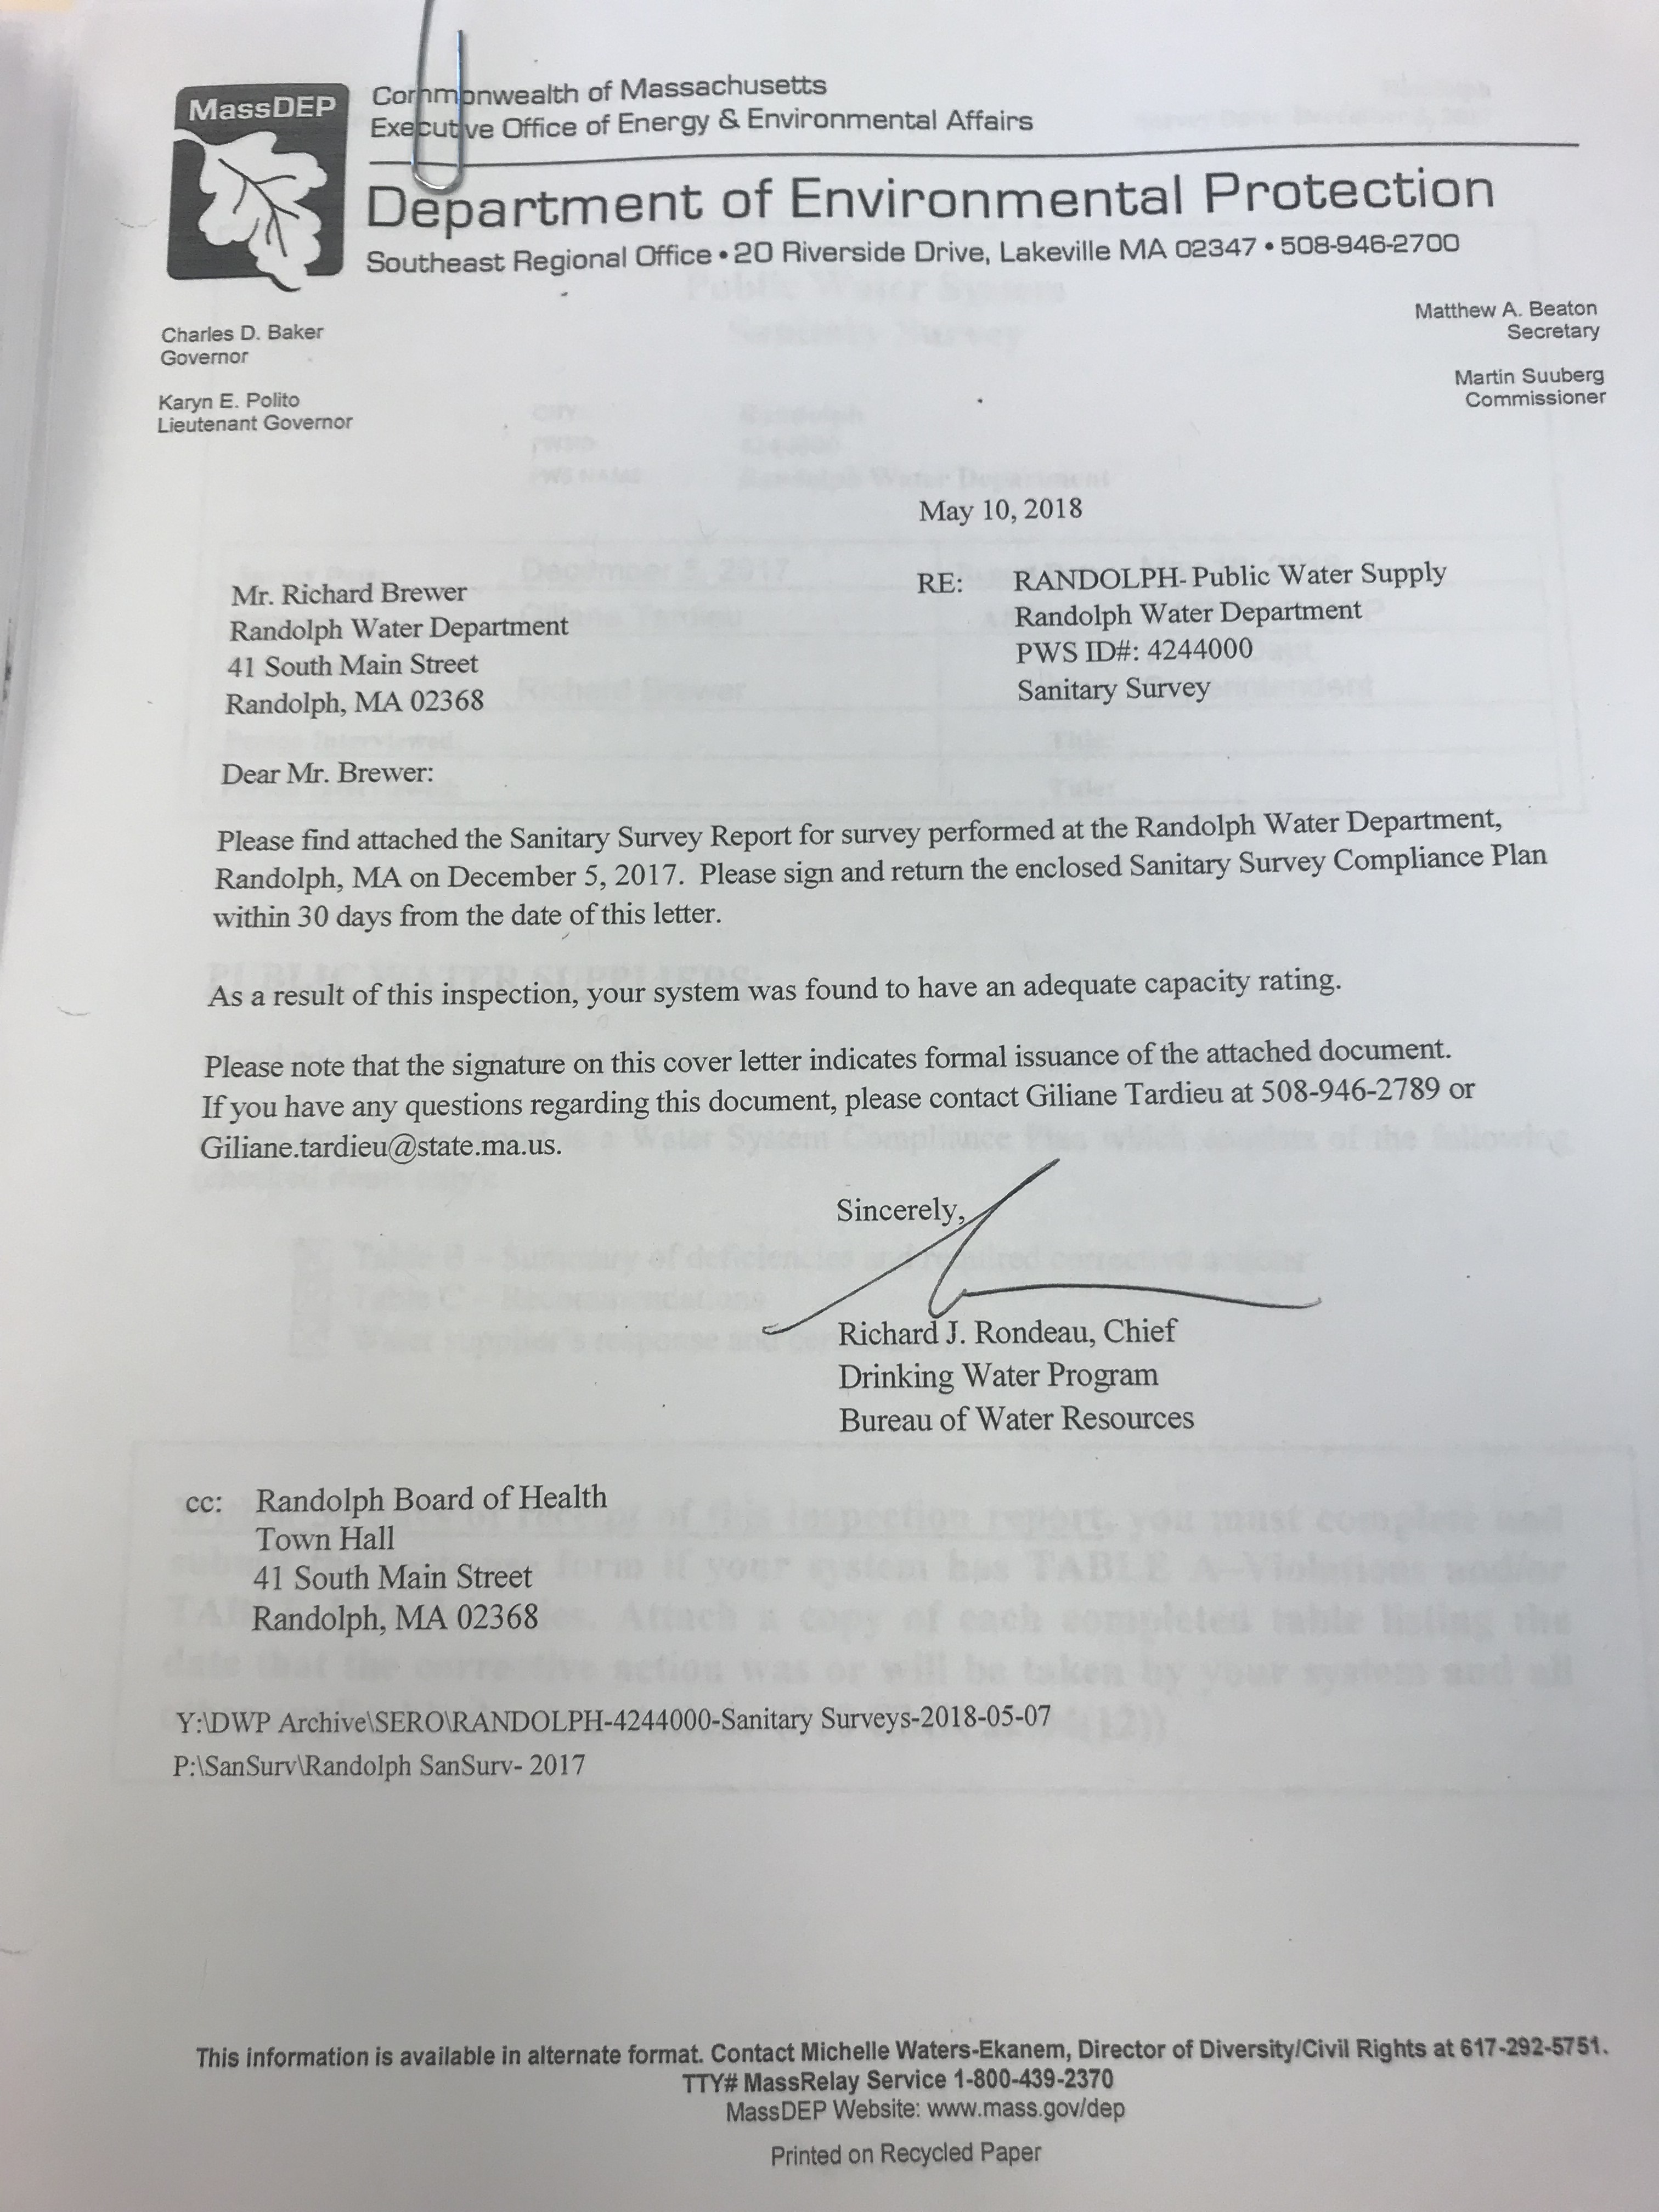
| Document 2128 | Summary report from MA DEP to DPW Director Richard Brewer |
| Document 2131 | Chlorine (disinfectant) |
Some conclusions from the above data:
- The brown discoloration in our water comes from disturbances in the pipes (this fact was established during the Sept. 12 water forum)
- The "Turbidity" measurements (that's the brown discoloration) are run continuously in the water treatment plant, in eight different filters, with reports of the continuous testing summarized daily.
- There are safety standards for turbidity -- if it's too brown (which they call "> 1.0 NTU") then it's a health risk (which they call "SWTR TT Violation (Tier 2)" for which the public must be notified).
- There are plenty of water quality data measurements done in the distribution system (e.g. chlorine is measured at each school, and elsewhere around town, in IMG_2119.JPG above)
- Turbidity measurements take place once monthly at one site in the distribution system (i.e. brown water color is not measured in dozens of sites weekly, like chorine is)
- Our town authorities say "the water is safe to drink even though it's discolored" by which they mean "we have met all health standards including testing for brown discoloration at the water treatment plant" -- but this does NOT apply to the distribution system! If you don't happen to be near the one monthly test site on the right day of the month, turbidity in your water is NOT tested!
- So... our water is tested for brown discoloration BEFORE the brown color gets added -- it's added in the pipes, AFTER almost all of the testing occurs!
- BOTTOM LINE: When you see brown water coming out of your tap, it is likely below healthy standards -- but our town does NOT test for most brown water in the water pipes! Don't drink brown water!
|